Gnuplot 6.0.5
by Gnuplot
A command-line program which greatly expands the extent of functions you are able to use
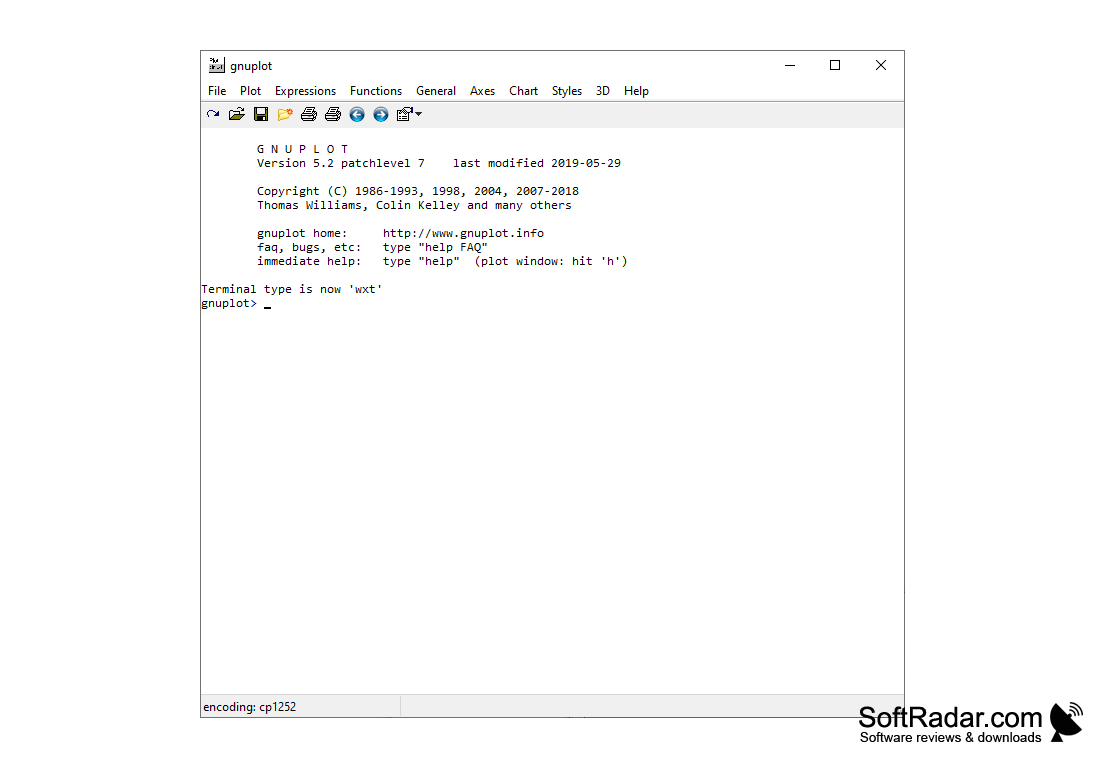
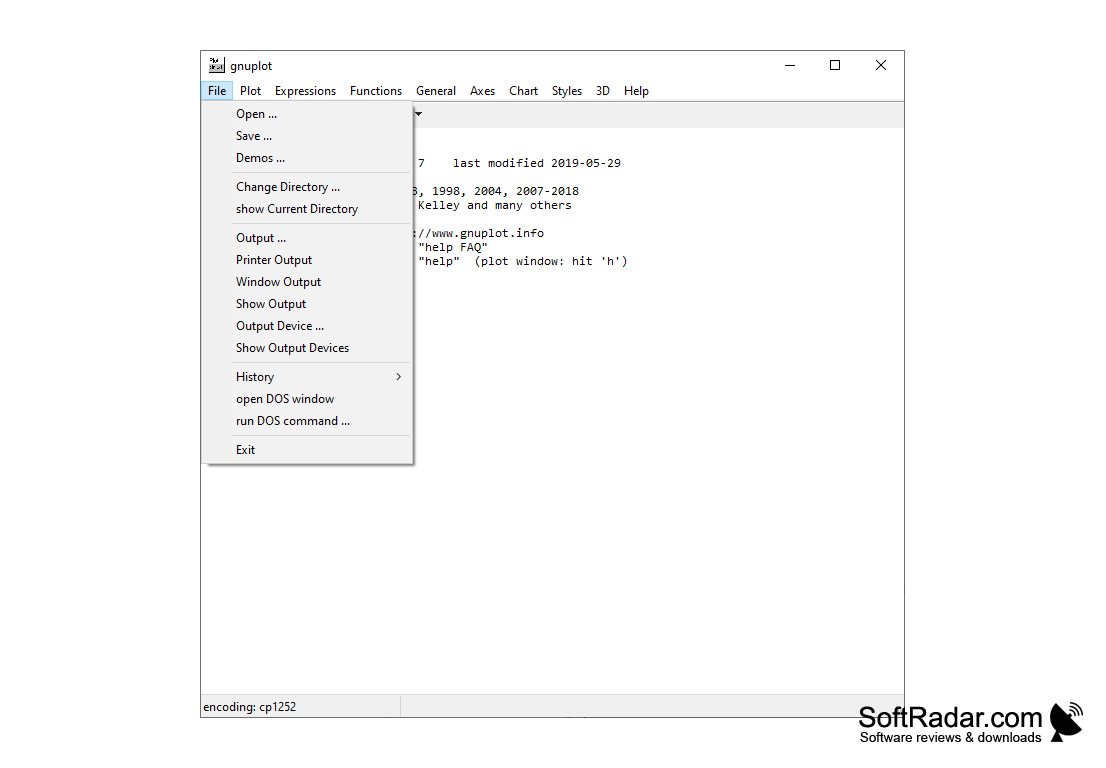
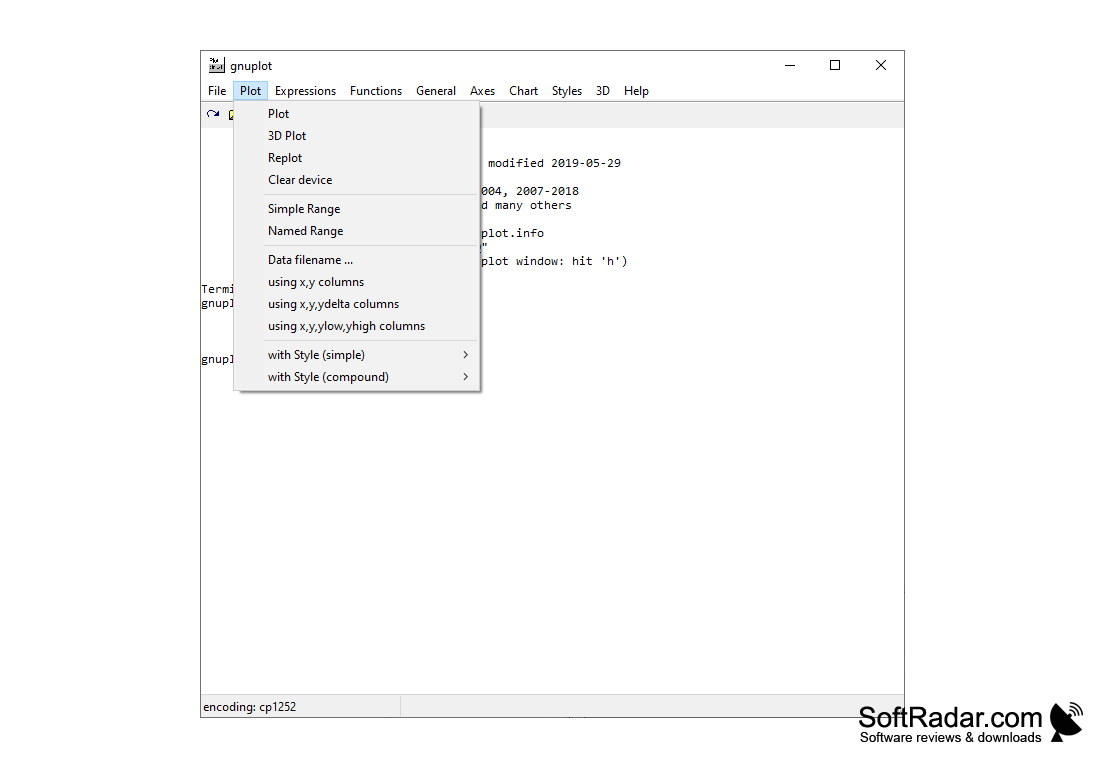
Gnuplot is a command-line plotting utility for creating customizable 2D and 3D graphs from mathematical expressions or data files, with scripting and output support for formats such as PNG, SVG, PDF, and interactive terminals. Gnuplot 6.0.5 is a maintenance release in the 6.0 series, suitable for scientific visualization, data analysis, and automated graph generation.
Operating system: Windows
Publisher: Gnuplot
Version: 6.0.5 (checksum)
Gnuplot 5.2.4
(25.99 MB)
Gnuplot 5.2.5
(25.78 MB)
Gnuplot 5.2.6
(26.38 MB)
Gnuplot 5.2.7
(26.27 MB)
Gnuplot 6.0.5
(46.37 MB)