Gnuplot

by Gnuplot

A command-line program which greatly expands the extent of functions you are able to use

Operating system: Windows

Publisher: Gnuplot

Release : Gnuplot 5.2.7

Antivirus check: passed

Report a Problem

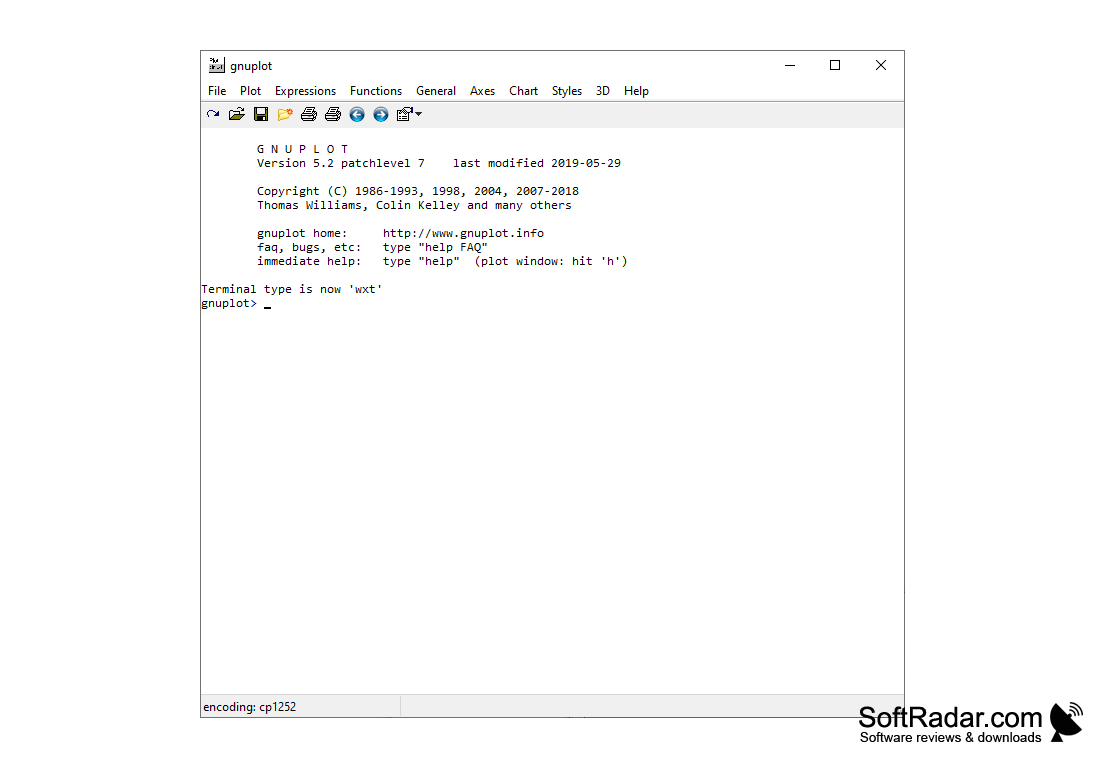
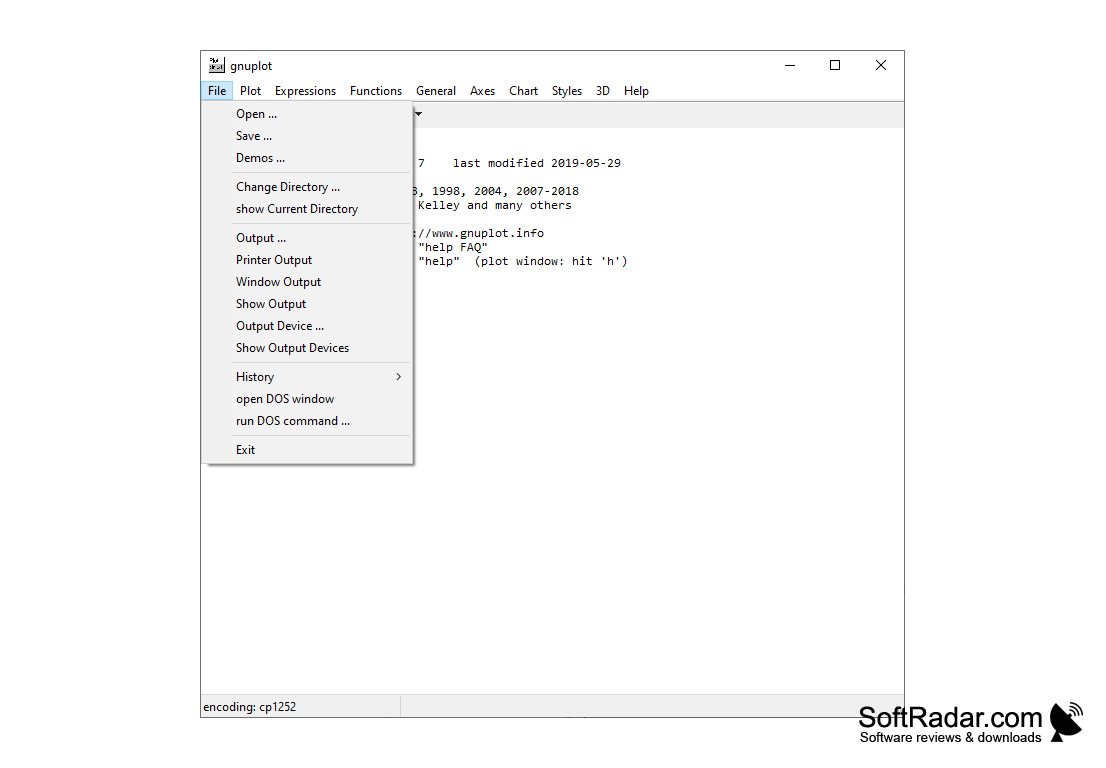
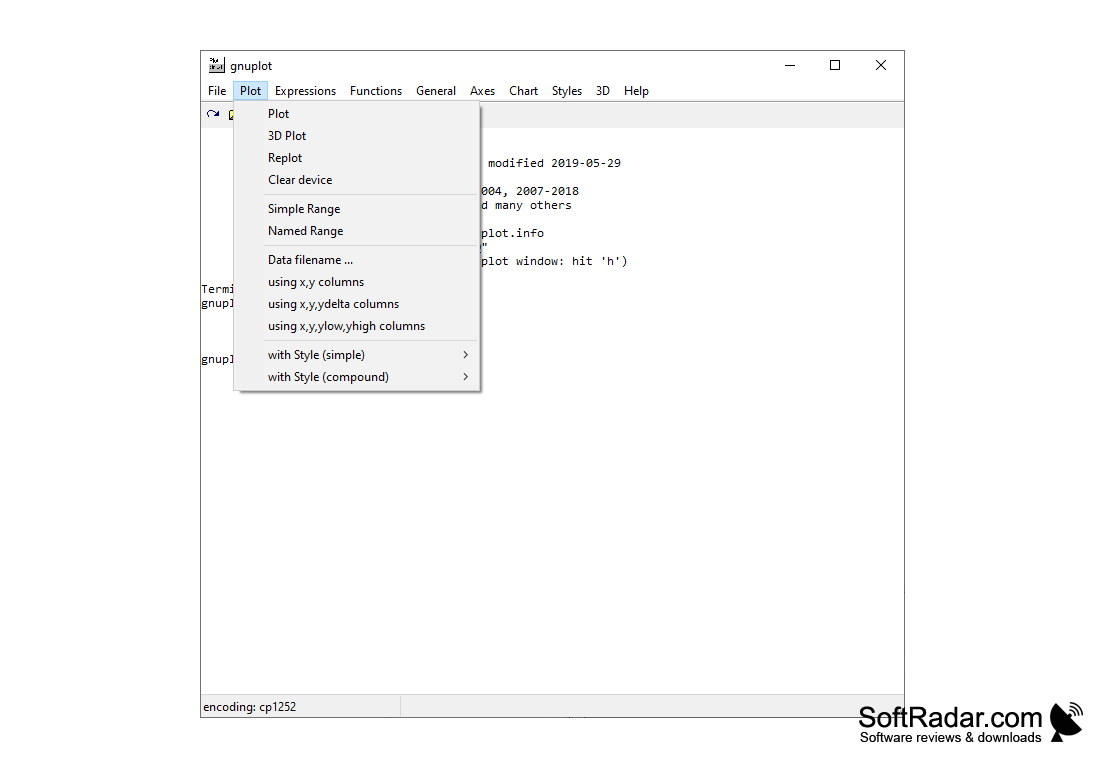
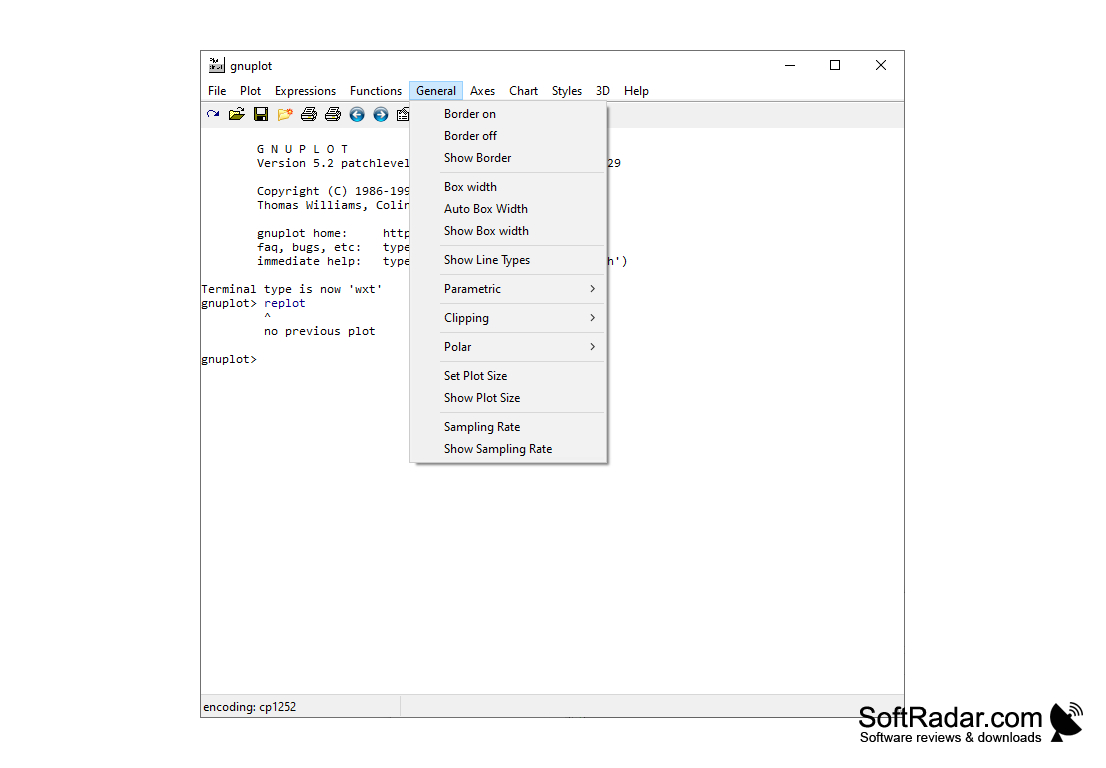
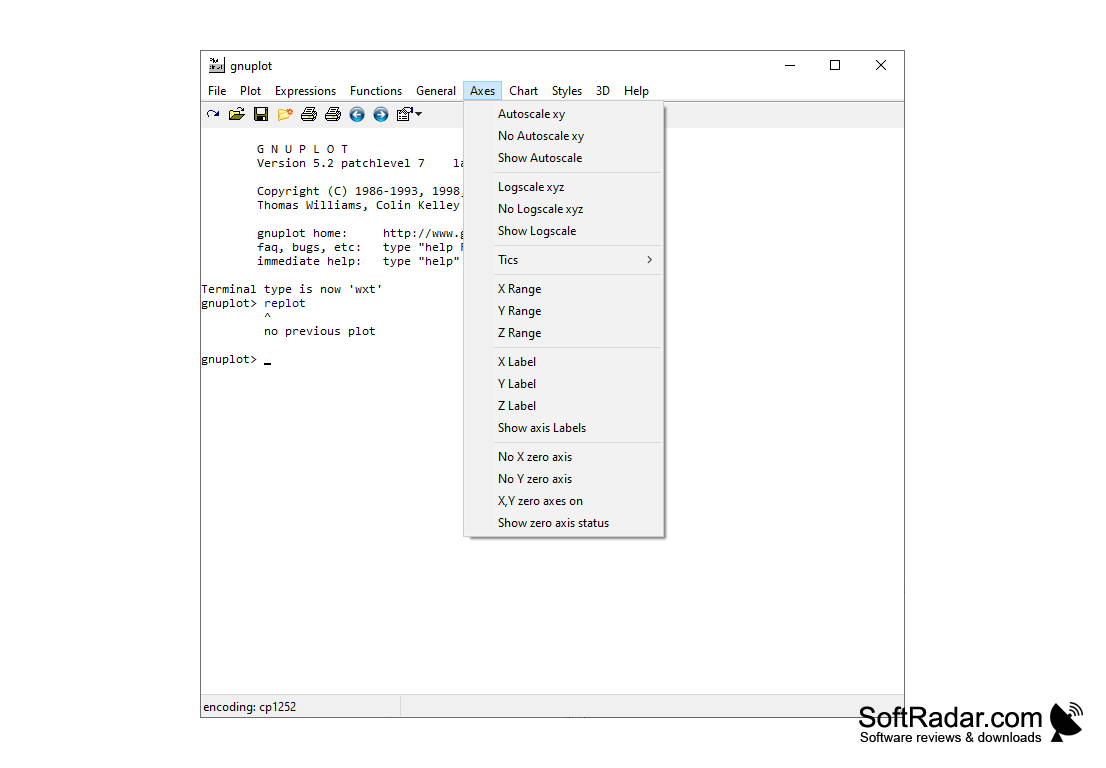
Gnuplot is a wonderful Windows free software program that serves as a command-line program. It can create two-dimensional plots, as well as three-dimensional plots of various data, functions, objects, and fits. It is compatible with all devices on Windows, as well as for Linux, Unix, and macOS. Using it on a Windows device, I am very impressed with the number of features that it has packed into it. For example, it creates an output that is shown on screen, and in several formats of graphic files.

You can use it in interactive mode, as well as in batches when you would like to work with scripts. Also, you can open and read data files which are of a variety of formats, such as the ability to have data read and generated by other programs you have, in the form of piping. It produces output that is shown right on screens such as PNG, JPEG, EPS, and SVG. This makes it not only versatile but also very packed with features as a utility program. With it, you are able to create a multitude of graphs and figures, including histograms, labels, box plots, line graphs, vectors, and other graph components and objects. This is an essential program to have when you are working with the command-line because, in association with it, it boosts your capabilities significantly.

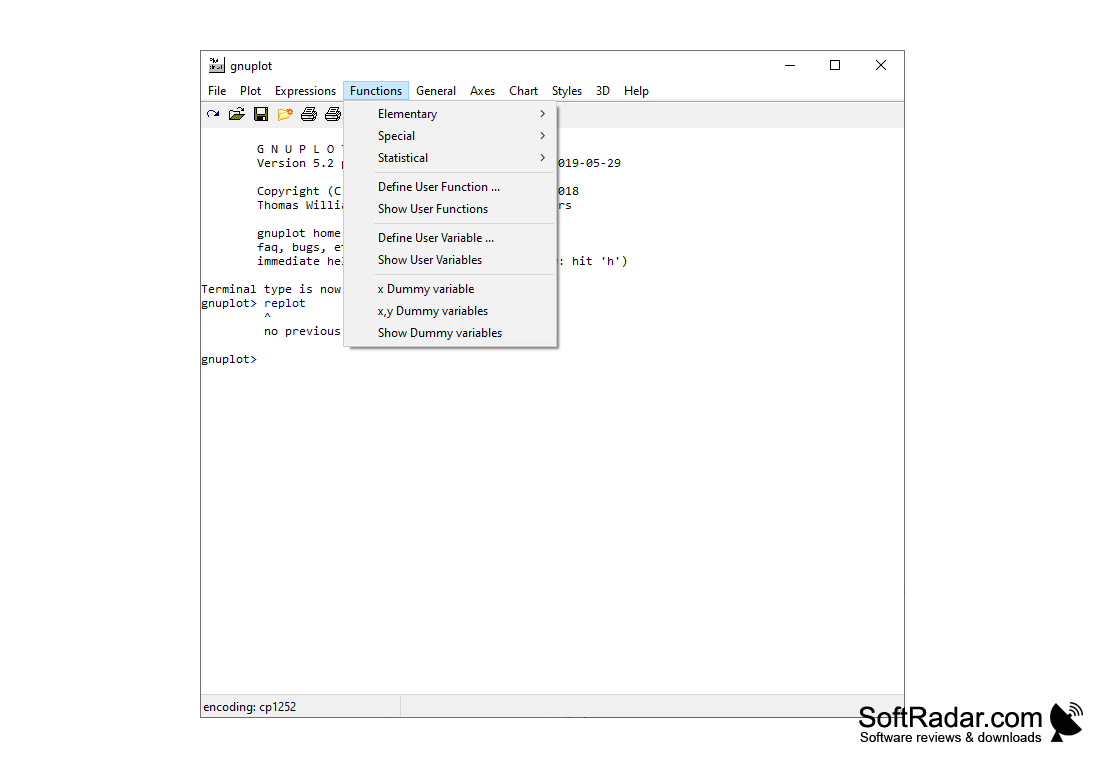
It allows the user to create their scripts, loops, features, variables, texts, macros, and functions, among other things. It enables you to work even with non-linear multi-set and multi-dimensional data sets for fitting in formats of curve fitting, for example.

The Code of the program is programmed in C., And peripheral outputs are via WT, LaTex, and wxWidgets, which are of C++. This is essential for those working with IT and in other aspects as well, as the command-line is basic, but with this program, you can expand upon what you are working with. It is also free to download and use, which is rare given how complicated its capabilities are.

It is user-friendly for those working with scripts, plots, and other data functions.

I would highly recommend to those working with projects in IT, or even students working with command-line that this program is looked at, as a tool and supplemental program which will make your learning experience just that much better and interactive. Please try this out and see if you like it!

Works in C language, but also compatible with peripheral outputs such as C++
Features:

  • Allows creation of 2D and 3D plots
  • Work with scripts, loops, features, variables, texts, macros, functions, etc.
  • Expands on command-line capabilities
  • Simple and easy to configure
  • Free to download
Operating system: Windows, Linux, Unix, or macOS
Command-line interface
Supports C., LaTex, and wxWidgets
Compatible with non-linear multi-set and multi-dimensional data sets

PROS
Supports many types of plots and customization options.
Free, open-source and widely used data visualization tool.
Platform-independent, runs on various operating systems.

CONS
Has a steep learning curve for beginners.
Lacks a graphical user interface.
Limited customization and graphic design options.
Gnuplot 5.2.4 (25.99 MB)
Gnuplot 5.2.5 (25.78 MB)
Gnuplot 5.2.6 (26.38 MB)
Gnuplot 5.2.7 (26.27 MB)
image/svg+xmlBotttsPablo Stanleyhttps://bottts.com/Florian Körner Kayden
Gnuplot is an open source command-line powered application primarily for mathematical graphing. As a student with both Windows and OSX based operating systems I really appreciate that Gnuplot supports a variety of operating systems. Although there are other math based graphing options out there, Gnuplot has been around since the mid 80s, and has a team of dedicated developers to constantly update the API as well as the documentation. In this licensed and private world I think we need to support more open source applications like Gnuplot.
image/svg+xmlBotttsPablo Stanleyhttps://bottts.com/Florian Körner Liam B********d
Gnuplot is a free and open source command-line plotting program. It can be used to generate plots, histograms, power spectra, bar charts, and other graphics of data. It supports many different types of output, including interactive web display. Gnuplot is frequently used by scientists and engineers to visualize data, and by students to learn about plotting.
image/svg+xmlBotttsPablo Stanleyhttps://bottts.com/Florian Körner Oliver R*******d
1. Gnuplot is a great software package for plotting 2D and 3D graphs. 2. It is highly customizable and supports a wide variety of data formats. 3. I find the interface quite intuitive and easy to use. 4. The documentation is comprehensive and the help function is very useful. 5. It is quite powerful and offers a lot of customization options. 6. The plotting speed is quite fast and the output is of good quality. 7. It is capable of producing a wide range of different types of plots. 8. I have had a few issues with installing the software, but these were quickly resolved. 9. It has a large library of sample plots which can be used as a starting point for your own creations. 10. Overall, I have found it to be a very useful tool for creating graphs.
image/svg+xmlBotttsPablo Stanleyhttps://bottts.com/Florian Körner Joshua Z***********j
I have been using Gnuplot for some of my research projects and I’ve found it to be an effective and powerful tool. I really appreciate the flexibility it offers in plotting data from different sources. The user interface is intuitive and provides numerous options for customizing graphs. I have also found the manual to be quite helpful.
image/svg+xmlBotttsPablo Stanleyhttps://bottts.com/Florian Körner Jayden Z**********c
Gnuplot is an extremly powerful plotting softwarre.
image/svg+xmlBotttsPablo Stanleyhttps://bottts.com/Florian Körner Jamie N.
Gnuplot is a powerful, command-driven software used for generating high-quality graphs and plots in various formats. It supports various data sources and provides a variety of plotting options, including 2D and 3D plots, histograms, and contour plots. It also allows users to customize their graphs with various styles, labels, and titles. Gnuplot can be used on various operating systems, including Windows, Linux, and macOS, and can be integrated with various programming languages, such as C, Python, and MATLAB. Its versatility makes it a popular tool among scientists, engineers, and data analysts.
image/svg+xmlBotttsPablo Stanleyhttps://bottts.com/Florian Körner Max M.
Gnuplot is a versatile and powerful software for generating high-quality graphs and visualizations.
image/svg+xmlBotttsPablo Stanleyhttps://bottts.com/Florian Körner Jay
Allows for precise graph plotting with a somewhat steep learning curve.
image/svg+xmlBotttsPablo Stanleyhttps://bottts.com/Florian Körner Aiden
Versatile, powerful graphing tool; steep learning curve.
image/svg+xmlBotttsPablo Stanleyhttps://bottts.com/Florian Körner Angus
Versatile, intuitive, powerful graphing capabilities.
Jayden
Powerful graph plotting software.
Card Data Recovery
An utility program that recovers lost data
libusb
Iibusb for Windows is a C library that provides standard access to USB devices across many platforms
Wondershare Dr.Fone for iOS
Data recovery software for iOS and Windows products
MapWindow GIS
The MapWindow Geographic Information System is a free and open desktop source
Ashampoo ZIP FREE
ZIP Compression tool which is free and easy to use