3D Grapher

by RomanLab Software

Allows for visual graphing on WIndows

Operating system: Windows

Publisher: RomanLab Software

Antivirus check: passed

Report a Problem

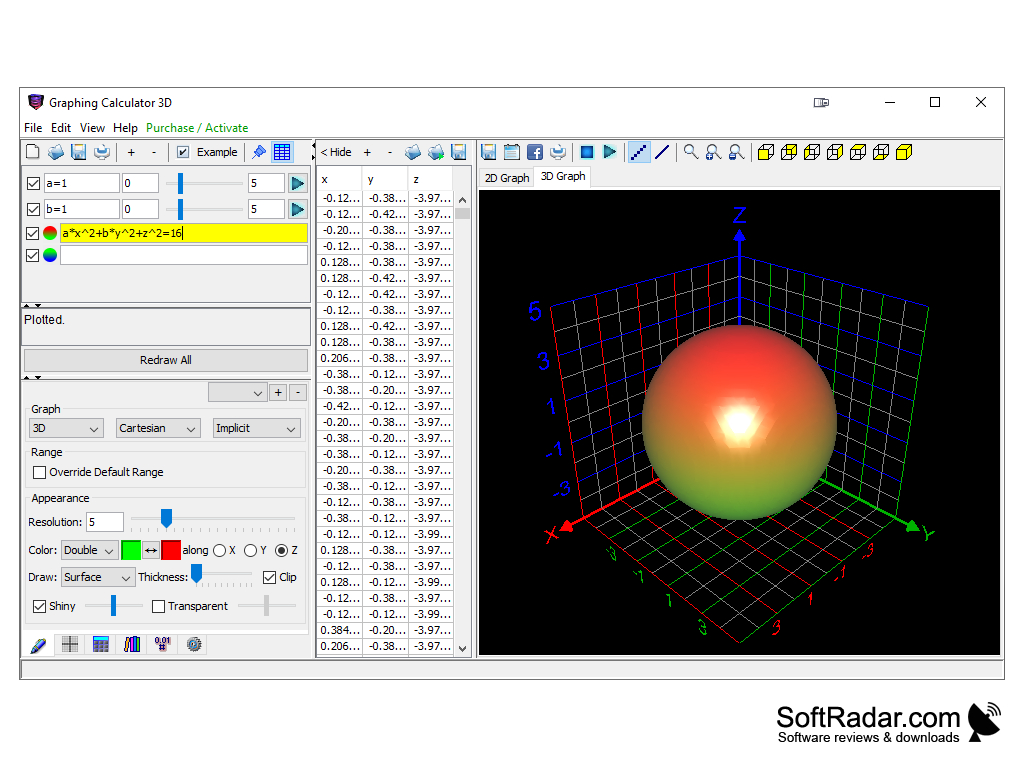
3D Grapher is a program for creating animated 2D and 3D equation graphs and displaying tabular data. Very convenient is that, thanks to this program, received, based on the specified coordinates, graphics can be rotated and moved, and if necessary, to change their scale. Thanks to this, you can view an unlimited number of charts at the same time, each of which is displayed by means of points, lines and surfaces. Presented analytical functions can contain up to three independent variables, including time variables for animation, and are set in parametric form. The coordinates of the cursor location are represented in the three-dimensional coordinate system or on the plane. The necessary animation effect and real-time display of graphics is also carried out thanks to modern hardware accelerators and, used by the program, the graphics library OpenGL. 3D Grapher is very convenient and easy to use.

3D Grapher allows users to easily create and interact with animated 2D and 3D equation graphs.
Minimum 2GB RAM for smooth functioning
Modern graphics card with OpenGL support
At least 500MB of available storage space
Operating System: Windows 7, 8, 10, MacOS, or Linux

PROS
Visualizes complex mathematical functions in three dimensions.
Interactive and easy-to-navigate user interface.
Supports a wide range of mathematical functions.

CONS
Steep learning curve for novice users.
Lacks advanced customization options for graphs.
Occasionally slow response with complex equations.
image/svg+xmlBotttsPablo Stanleyhttps://bottts.com/Florian Körner Ollie
This is a great program to use with a Windows operating system, used for creating 2D and 3D graphs with ease and precision. It has many functionalities and is simple and convenient to use. Developed by RomanLabs and rated highly by users, I recommend this product.
image/svg+xmlBotttsPablo Stanleyhttps://bottts.com/Florian Körner Riley
a great app to have informs and analysis of the charts, this is a very useful app or software for traders, this evaluate maximum or minimum of the stocks in a certain interval of time, is a equation solution chart.
image/svg+xmlBotttsPablo Stanleyhttps://bottts.com/Florian Körner Cameron
First of all, the 3D Plot Grapher just looks super cool, which is what got me to use it in the first place. From there, it became clear how deep you can go on customizations, bringing all the different functions to life, and playing with data. My only regret is not having enough time to explore all the different things you can do with this tool.
WindRose PRO
A editer and grammer edit software for your documents
3D Tool
View 3D tool for windows processing
Graph Plotter
Plots graphs virtually for windows
GetData Graph Digitizer
Allows for virtual graph for windows
Cutting Optimization Pro
Cuts and nests layouts for windows providers