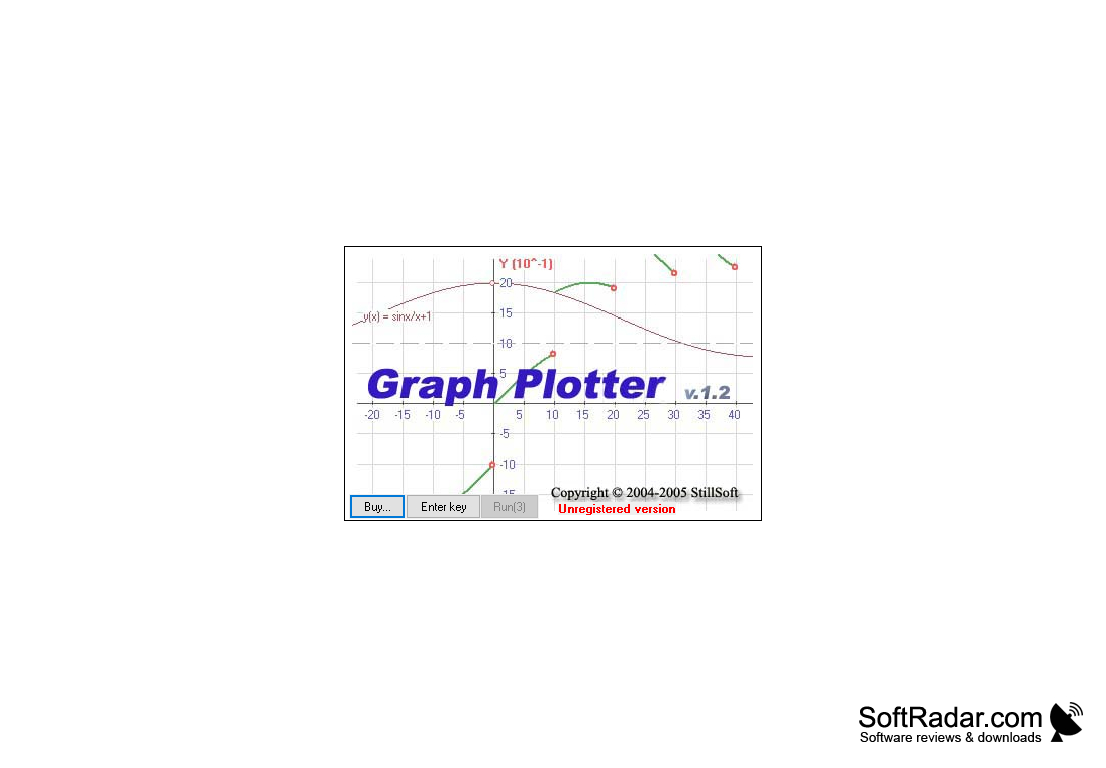
Graph Plotter
by Still Soft
Plots graphs virtually for windows
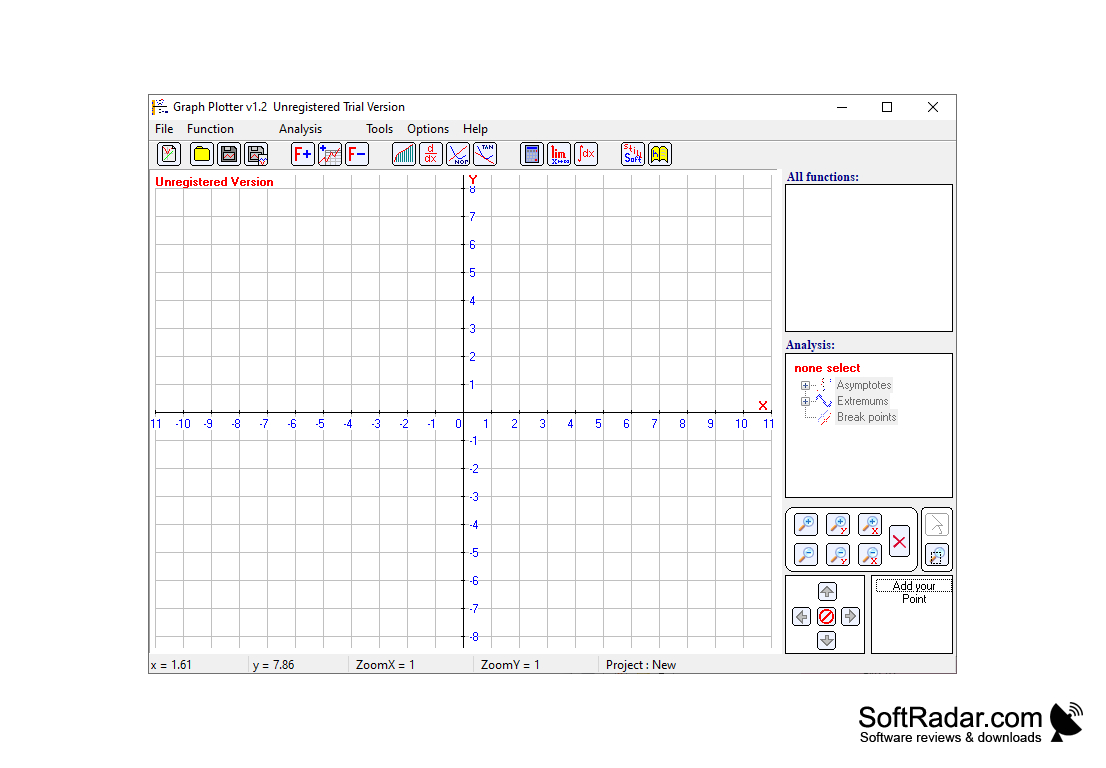
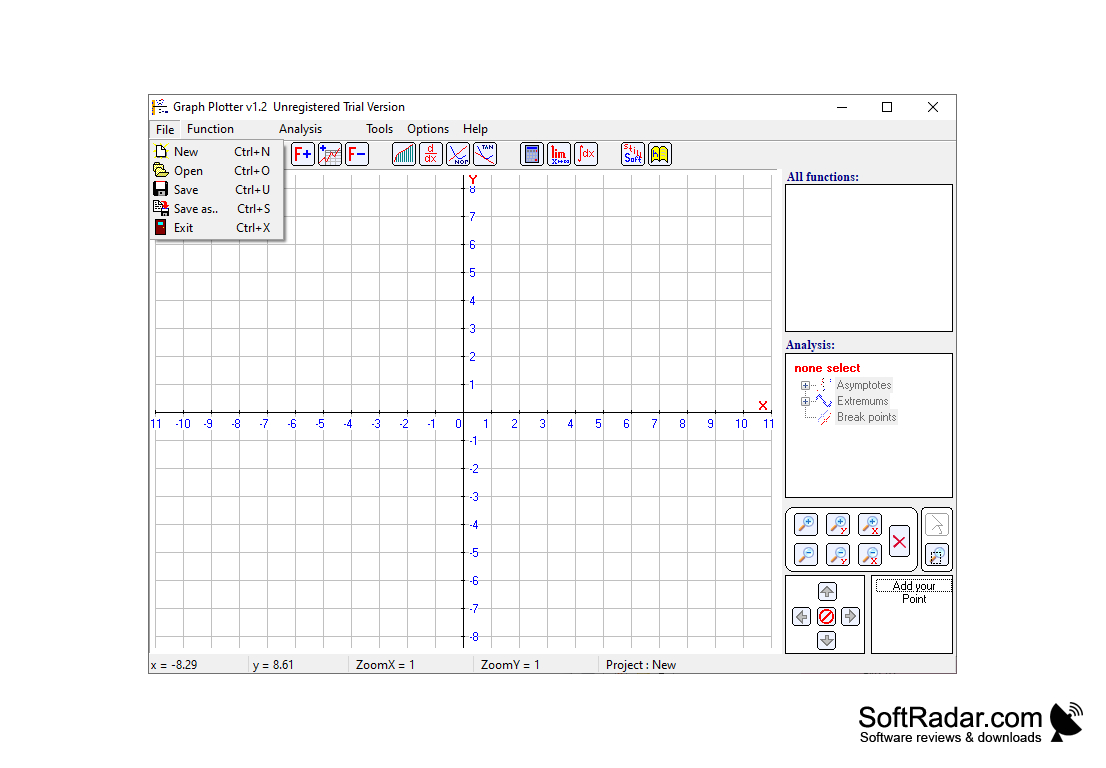
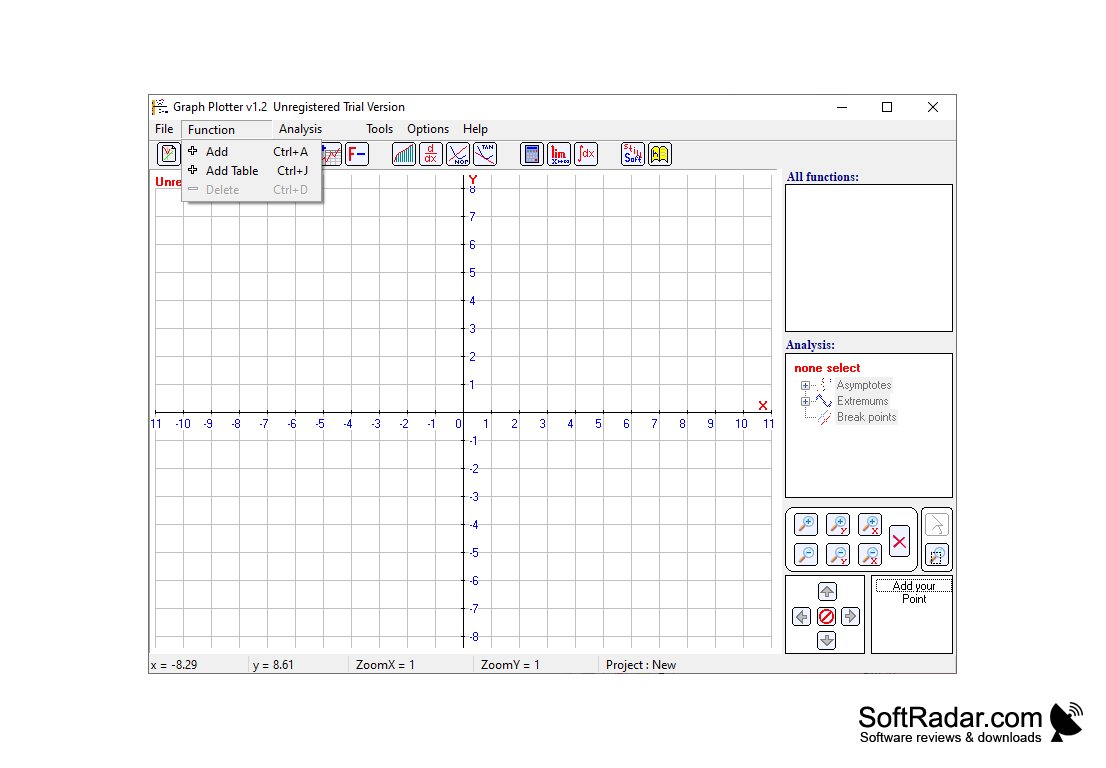
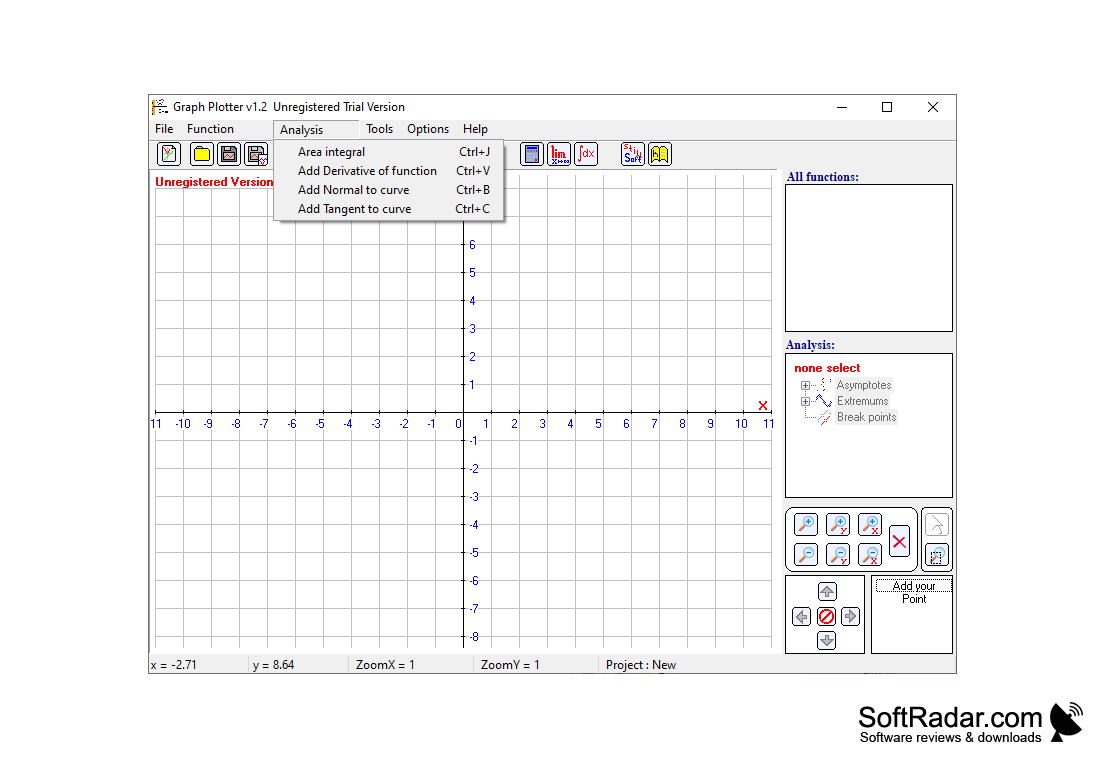
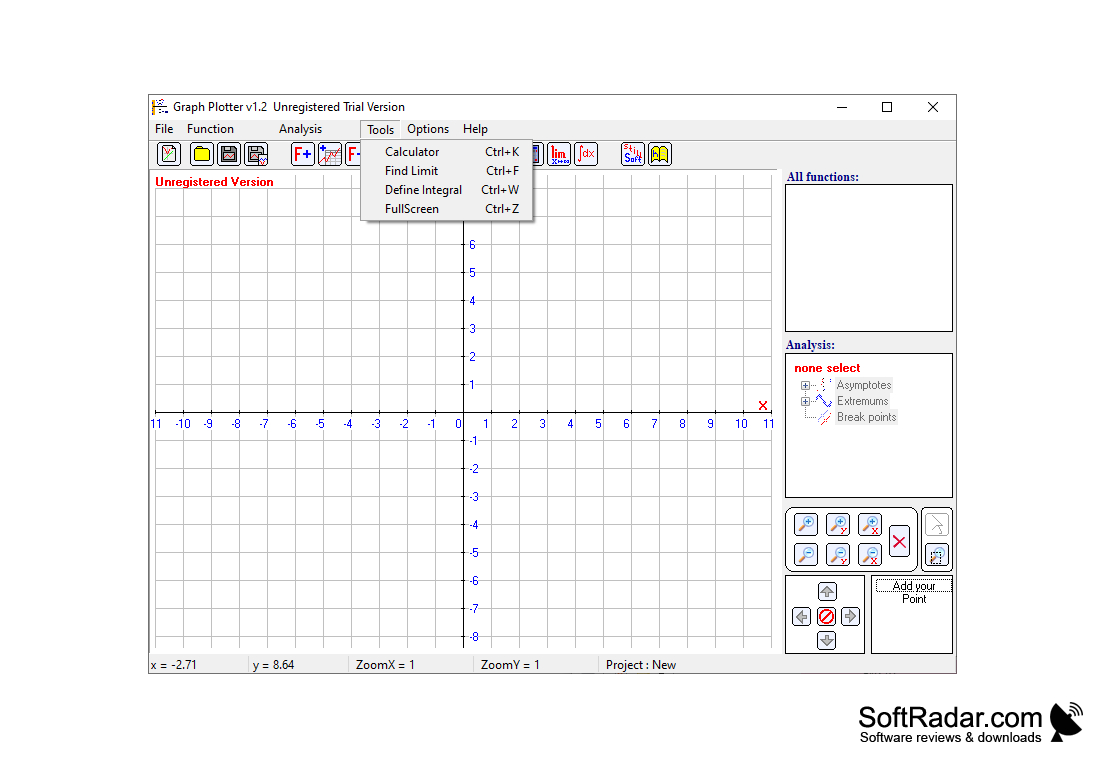
Graph Plotter is an application for building and analyzing function charts. Graph Plotter is able to build many types of charts, including parametric function charts, equation solution charts, etc. The user of the program can define the maximum and minimum values at a certain interval of the chart, calculate asymptotes and limits, use integrals and differentials, trigonometric functions, etc. The appearance of the charts is adjustable - you can use different colors, coordinate grid, etc. Created projects can be saved for later use. Tools are available for function analysis. There is a built-in engineering calculator.
Graph Plotter simplifies the process of building and analyzing complex function charts.
1. OS: Windows 7 or higher; macOS 10.12 or newer
2. At least 2 GB RAM for smooth operation
3. Minimum 500 MB free storage space
4. Requires .NET Framework 4.7.2 or higher
2. At least 2 GB RAM for smooth operation
3. Minimum 500 MB free storage space
4. Requires .NET Framework 4.7.2 or higher
PROS
Facilitates easy and accurate graph plotting.
Offers a variety of graphing options.
Saves time in creating complex diagrams.
Offers a variety of graphing options.
Saves time in creating complex diagrams.
CONS
Can have a steep learning curve for beginners.
Limited customization options for graphs.
May not support advanced statistical tools.
Limited customization options for graphs.
May not support advanced statistical tools.