RRDtool
by Tobias Oetiker
RRDtool is a high performance data logging and graphing system for time series data.
RRDtool is an industry-standard open source software package for storing and displaying time-series data. It is used extensively by system administrators, network engineers, and other IT professionals for monitoring and troubleshooting applications, services, and the infrastructure.
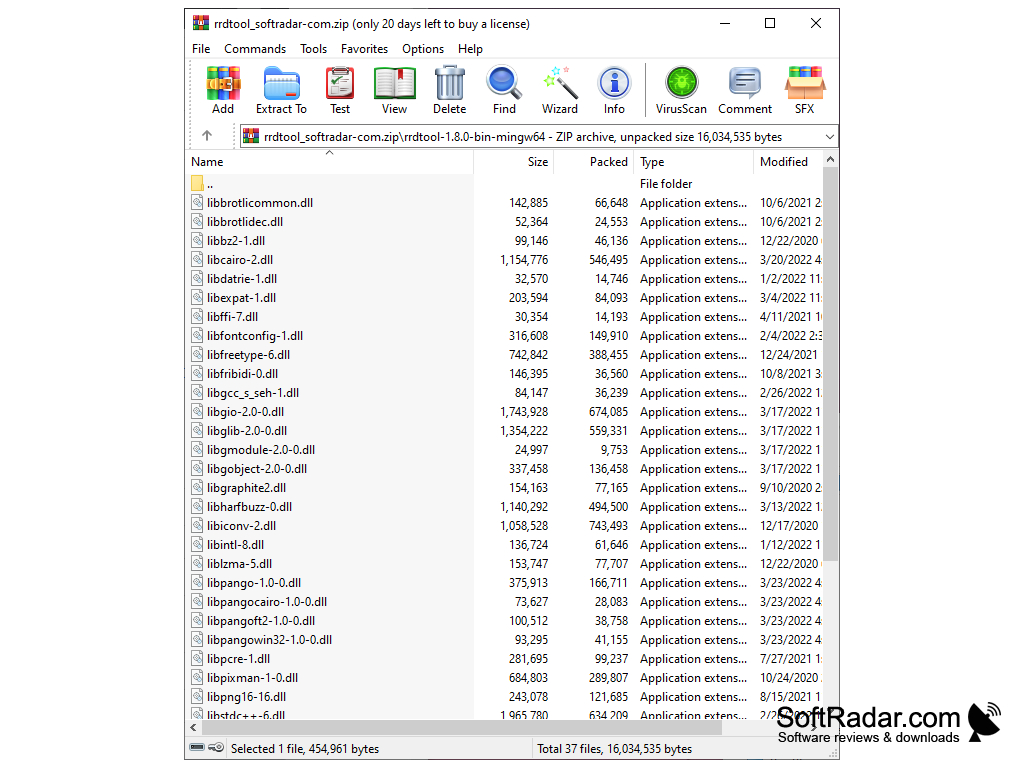
RRDtool is a data logging and graphing system. It allows users to store data in round-robin database (RRD) files, and then quickly generate graphs of that data. It is written in C, and is very fast and efficient.
- Round-robin databases: RRDtool stores data in round-robin database (RRD) files which are efficient, compact, and easy to use.
- Data sources: RRDtool supports various data sources such as counter, gauge, absolute, derive, and more.
- Consolidation functions: RRDtool provides a set of consolidation functions such as AVERAGE, MIN, MAX, LAST, and TOTAL.
- Graphs: RRDtool can generate various types of graphs such as line, area, stack, and more.
- Alarms: RRDtool can be used to set alarms which can be triggered when certain conditions are met.
- Thresholds: RRDtool allows users to set thresholds on data sources which can be used to limit or flag values.
- Plugins: RRDtool provides a set of plugins which can be used to extend the functionality of the system.
- Time-series data: RRDtool can convert data into time-series data which can be used for further analysis.
- Scalability: RRDtool is highly scalable and can store large amounts of data efficiently.
- Extensibility: RRDtool can be extended using custom code, which allows for more flexibility.
- Open source: RRDtool is open source software, which means that it can be freely modified and redistributed.
- Cross-platform: RRDtool is available on a variety of platforms, including Linux, Mac OS X, and Windows.
RRDtool is a data logging and graphing system. It allows users to store data in round-robin database (RRD) files, and then quickly generate graphs of that data. It is written in C, and is very fast and efficient.
RRDtool allows for efficient storage of time-series data with high resolution over long periods of time.Features:
- Round-robin databases: RRDtool stores data in round-robin database (RRD) files which are efficient, compact, and easy to use.
- Data sources: RRDtool supports various data sources such as counter, gauge, absolute, derive, and more.
- Consolidation functions: RRDtool provides a set of consolidation functions such as AVERAGE, MIN, MAX, LAST, and TOTAL.
- Graphs: RRDtool can generate various types of graphs such as line, area, stack, and more.
- Alarms: RRDtool can be used to set alarms which can be triggered when certain conditions are met.
- Thresholds: RRDtool allows users to set thresholds on data sources which can be used to limit or flag values.
- Plugins: RRDtool provides a set of plugins which can be used to extend the functionality of the system.
- Time-series data: RRDtool can convert data into time-series data which can be used for further analysis.
- Scalability: RRDtool is highly scalable and can store large amounts of data efficiently.
- Extensibility: RRDtool can be extended using custom code, which allows for more flexibility.
- Open source: RRDtool is open source software, which means that it can be freely modified and redistributed.
- Cross-platform: RRDtool is available on a variety of platforms, including Linux, Mac OS X, and Windows.
RRDtool runs on many flavors of Unix, Linux, and OSX. It also runs on Windows and other platforms, but only through the use of third-party packages. The minimum requirements for RRDtool to run properly are:
-A POSIX-compliant operating system
-A C compiler (gcc or clang)
-GNU Make
-Perl
-Libtool
-GNU Autoconf
-GNU Automake
-Libxml2
-Pango
-Cairo
-librrd (the RRDtool library)
-RRDTool (the RRDtool executable)
-RRD Graph (the RRDtool graphing utility)
-A POSIX-compliant operating system
-A C compiler (gcc or clang)
-GNU Make
-Perl
-Libtool
-GNU Autoconf
-GNU Automake
-Libxml2
-Pango
-Cairo
-librrd (the RRDtool library)
-RRDTool (the RRDtool executable)
-RRD Graph (the RRDtool graphing utility)
PROS
Efficient storage and retrieval of time-series data.
Provides detailed and customizable graphing capabilities.
Supports a variety of data sources.
Provides detailed and customizable graphing capabilities.
Supports a variety of data sources.
CONS
Steep learning curve for beginners.
Limited documentation and user support.
Not user-friendly, requires programming knowledge.
Limited documentation and user support.
Not user-friendly, requires programming knowledge.