Ternary Diagram
by ProSim
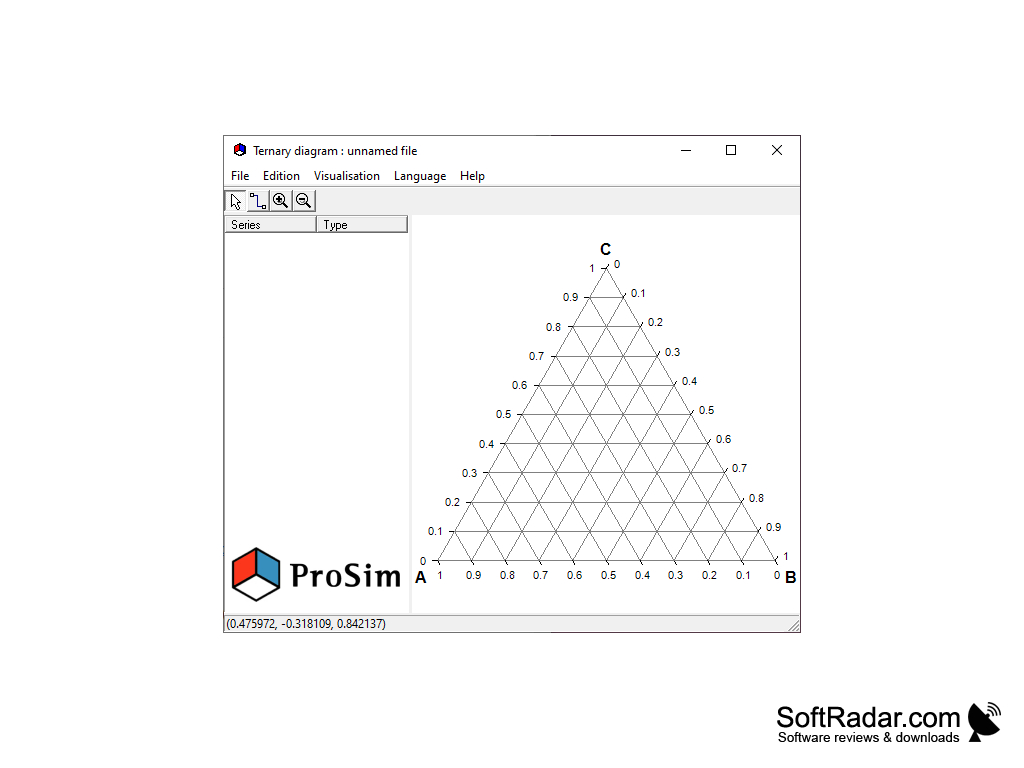
Ternary Diagram software is a graphical tool used to visualize data in three dimensions, typically as a triangular plot.
Ternary Diagram Software
Ternary diagram software is a specialized type of diagramming software used to create ternary diagrams, which are diagrams that display the relative proportions of three variables in a triangular format. This type of diagram is commonly used in many scientific fields, including geology, mineralogy, petrology, and soil science, to represent the proportions of three components in a mixture.
Ternary diagram software can be used to create custom diagrams for scientific data analysis, research, and presentation. It features several features that make it easier to manipulate and visualize the data, including a wide range of customizable options, an interactive user interface, and a variety of data import and export capabilities.
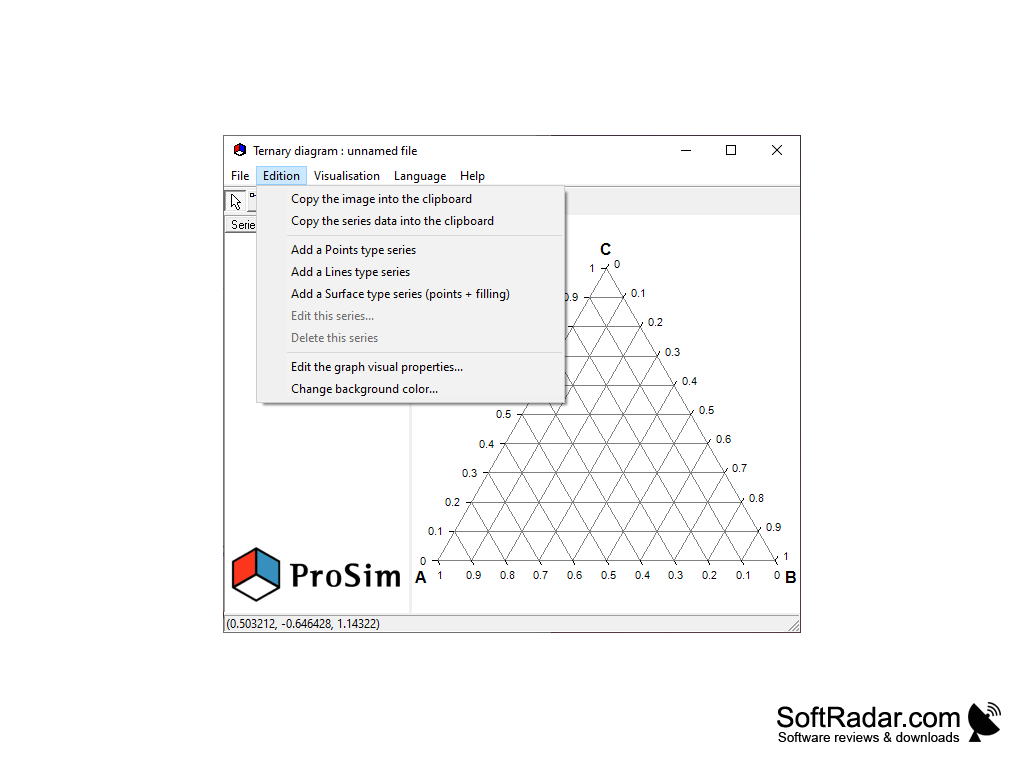
• Customizable options: Ternary diagram software allows users to customize their diagrams, including the size of the chart, chart type, color palette, and more.
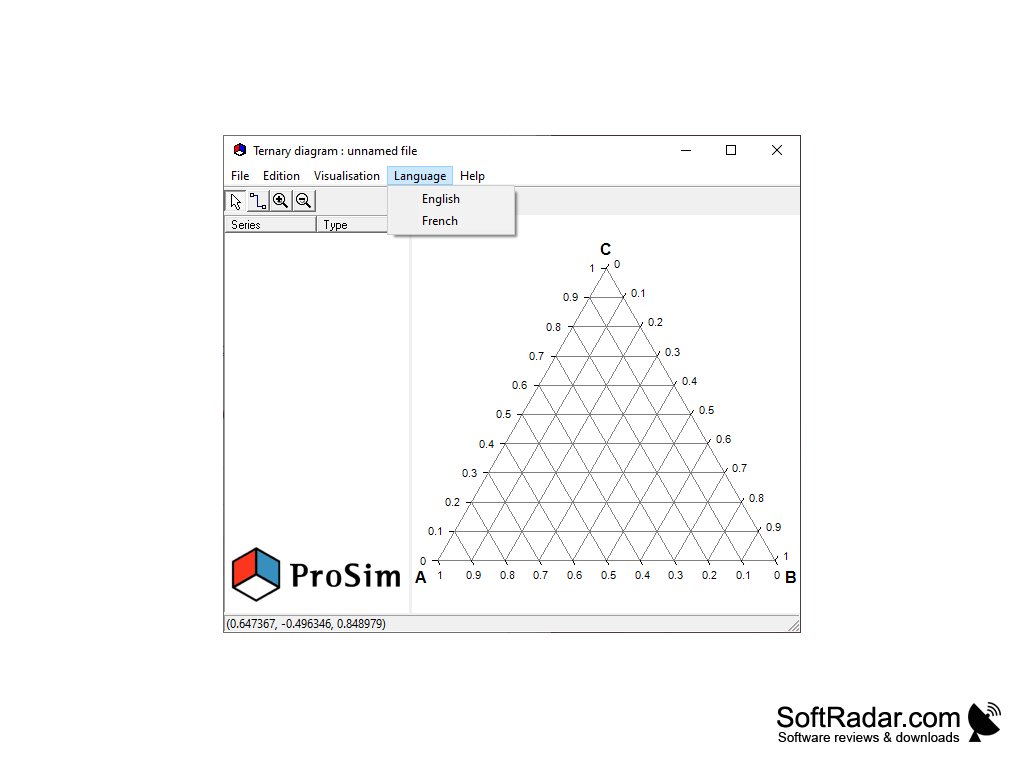
• Interactive user interface: The program features an intuitive, interactive user interface that makes it easier to manipulate and visualize the data.
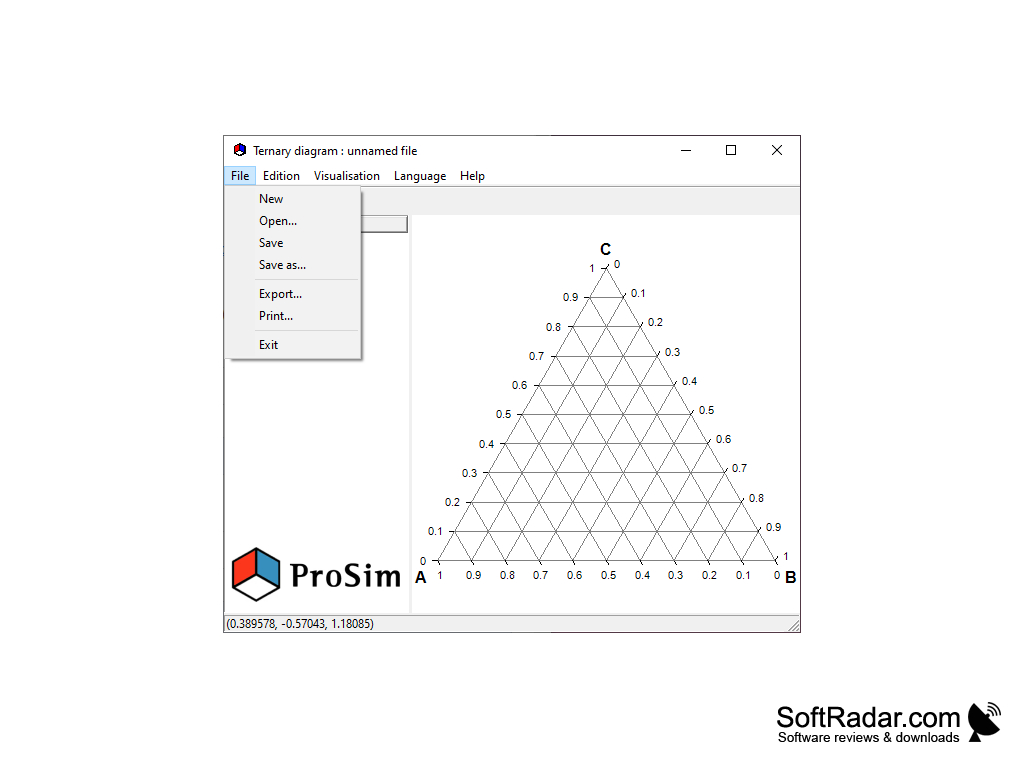
• Data import and export capabilities: Ternary diagram software allows users to import and export data from a variety of sources, including spreadsheets and databases.
• Multi-dimensional data support: The program supports multi-dimensional data sets, allowing users to represent multiple variables in a single chart.
• Visualization tools: Ternary diagram software includes a variety of visualization tools, such as line graphs, bar graphs, and pie charts, to help users visualize their data.
• Statistical analysis: The software includes a variety of statistical analysis tools, such as correlation analysis, regression analysis, and more.
• Flexible formatting options: Users can choose from a wide range of flexible formatting options, including font size, line width, and more.
• Automatic updates: The program includes automatic updates to ensure users are always using the latest version of the software.
• Compatibility: Ternary diagram software is compatible with a variety of operating systems, including Windows, Mac, and Linux.
Conclusion
Ternary diagram software is a specialized type of software designed to help users create ternary diagrams for data analysis, research, and presentation. It features a wide range of customizable options, an interactive user interface, and a variety of data import and export capabilities. Furthermore, the software includes several visualization tools and statistical analysis tools, as well as flexible formatting options and automatic updates. Thanks to its compatibility with many different operating systems, ternary diagram software is a great tool for creating custom diagrams to represent the proportions of three components in a mixture.
Ternary diagram software is a specialized type of diagramming software used to create ternary diagrams, which are diagrams that display the relative proportions of three variables in a triangular format. This type of diagram is commonly used in many scientific fields, including geology, mineralogy, petrology, and soil science, to represent the proportions of three components in a mixture.
Ternary diagram software can be used to create custom diagrams for scientific data analysis, research, and presentation. It features several features that make it easier to manipulate and visualize the data, including a wide range of customizable options, an interactive user interface, and a variety of data import and export capabilities.
A ternary diagram is useful for visually representing the relative proportions of three variables in a single plot.Features:
• Customizable options: Ternary diagram software allows users to customize their diagrams, including the size of the chart, chart type, color palette, and more.
• Interactive user interface: The program features an intuitive, interactive user interface that makes it easier to manipulate and visualize the data.
• Data import and export capabilities: Ternary diagram software allows users to import and export data from a variety of sources, including spreadsheets and databases.
• Multi-dimensional data support: The program supports multi-dimensional data sets, allowing users to represent multiple variables in a single chart.
• Visualization tools: Ternary diagram software includes a variety of visualization tools, such as line graphs, bar graphs, and pie charts, to help users visualize their data.
• Statistical analysis: The software includes a variety of statistical analysis tools, such as correlation analysis, regression analysis, and more.
• Flexible formatting options: Users can choose from a wide range of flexible formatting options, including font size, line width, and more.
• Automatic updates: The program includes automatic updates to ensure users are always using the latest version of the software.
• Compatibility: Ternary diagram software is compatible with a variety of operating systems, including Windows, Mac, and Linux.
Conclusion
Ternary diagram software is a specialized type of software designed to help users create ternary diagrams for data analysis, research, and presentation. It features a wide range of customizable options, an interactive user interface, and a variety of data import and export capabilities. Furthermore, the software includes several visualization tools and statistical analysis tools, as well as flexible formatting options and automatic updates. Thanks to its compatibility with many different operating systems, ternary diagram software is a great tool for creating custom diagrams to represent the proportions of three components in a mixture.
1. The software should be capable of creating and editing ternary diagrams.
2. It should be compatible with Windows, Mac, or Linux operating systems.
3. It should have the ability to export diagrams to a variety of file formats, such as PDF, SVG, and PNG.
4. It should be able to allow users to customize the appearance of the diagrams, including changing the colors, labels, and styles of the diagrams.
5. It should provide the ability to add custom annotations to diagrams.
6. It should support data import from CSV and other formats.
7. It should include advanced features, such as the ability to compare multiple datasets and create interactive diagrams.
8. It should be easy to use with a user-friendly interface.
9. It should be available with reasonable cost or free of charge.
PROS
Easy to create, visualize and interpret complex ternary plot data.
Supports numerous formats for data import and export.
Comprehensive customization options for detailed data representation.
Supports numerous formats for data import and export.
Comprehensive customization options for detailed data representation.
CONS
Limited to displaying only three-component systems.
Difficult for beginners to understand and use.
Lacks efficient customer support and updates.
Difficult for beginners to understand and use.
Lacks efficient customer support and updates.