ParaView
by Kitware Inc.
ParaView is an open-source, multi-platform data analysis and visualization application.
Operating system: Windows
Publisher: Kitware Inc.
Release : ParaView 3.12.0
Antivirus check: passed
ParaView is an open-source, multi-platform data analysis and visualization application. Developed by Kitware Inc., ParaView is an application for interactively visualizing and analyzing data. It is designed to run on a variety of systems including Windows, Linux, and Mac OSX.
ParaView was designed to be a scalable, multi-platform application that can be used by a wide range of users, from scientists and engineers to non-technical users. It supports a wide range of data formats, including structured and unstructured grids, polygonal meshes, image data, and point-based data, and can be used to visualize large data sets. ParaView offers a range of features to make it easy to analyze and visualize data, including a powerful 3D rendering engine, a flexible user interface, and an extensive set of visualization tools.
• Data Formats: ParaView supports a wide range of data formats, including structured and unstructured grids, polygonal meshes, image data, and point-based data.
• Visualization: ParaView offers a range of visualization tools, including 3D rendering, interactive plotting, volume rendering, and animation.
• Analysis: ParaView offers a range of analysis tools that allow users to measure, analyze, and interpret data.
• Filtering: ParaView offers a variety of filters, including traditional filters such as Gaussian blur and edge detection, as well as advanced filters for data manipulation and feature detection.
• Animation: ParaView offers a powerful animation system, allowing users to create and modify animations quickly and easily.
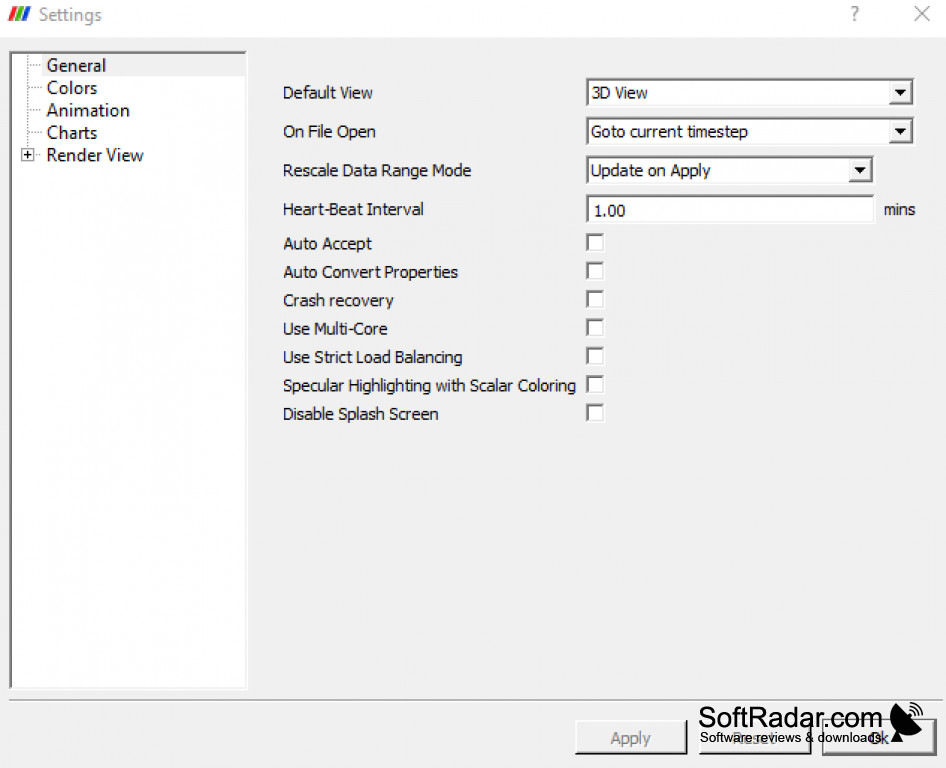
• User Interface: ParaView has a flexible user interface, allowing users to customize their experience to fit their needs.
• Collaboration: ParaView offers collaborative tools, allowing users to share and collaborate on data analysis and visualization projects.
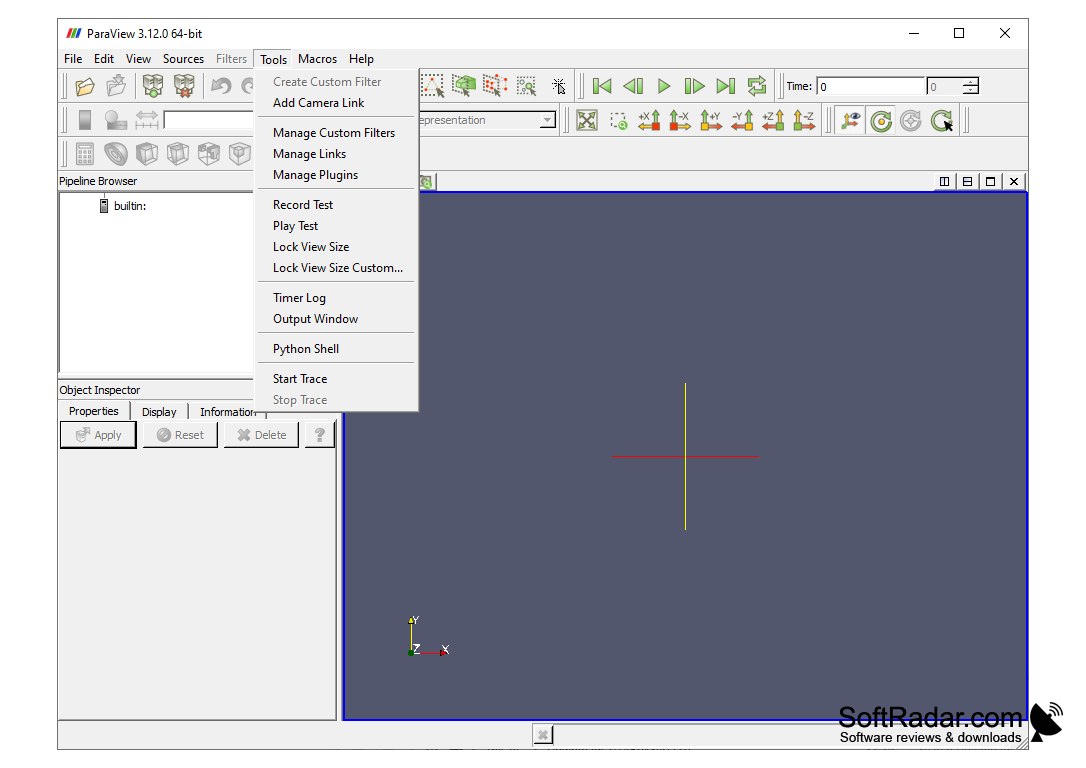
• Scripting: ParaView offers a scripting API, allowing users to extend the functionality of the application and automate tasks.
• Extensions: ParaView offers a range of extension modules, allowing users to access additional features and tools.
• Visualization Pipelines: ParaView offers a powerful visualization pipeline API, allowing users to create complex visualizations.
• Rendering: ParaView offers a range of advanced rendering techniques, such as ambient occlusion and global illumination.
• Parallel Processing: ParaView offers support for parallel processing, allowing users to take advantage of multi-core processors and distributed computing resources.
ParaView was designed to be a scalable, multi-platform application that can be used by a wide range of users, from scientists and engineers to non-technical users. It supports a wide range of data formats, including structured and unstructured grids, polygonal meshes, image data, and point-based data, and can be used to visualize large data sets. ParaView offers a range of features to make it easy to analyze and visualize data, including a powerful 3D rendering engine, a flexible user interface, and an extensive set of visualization tools.
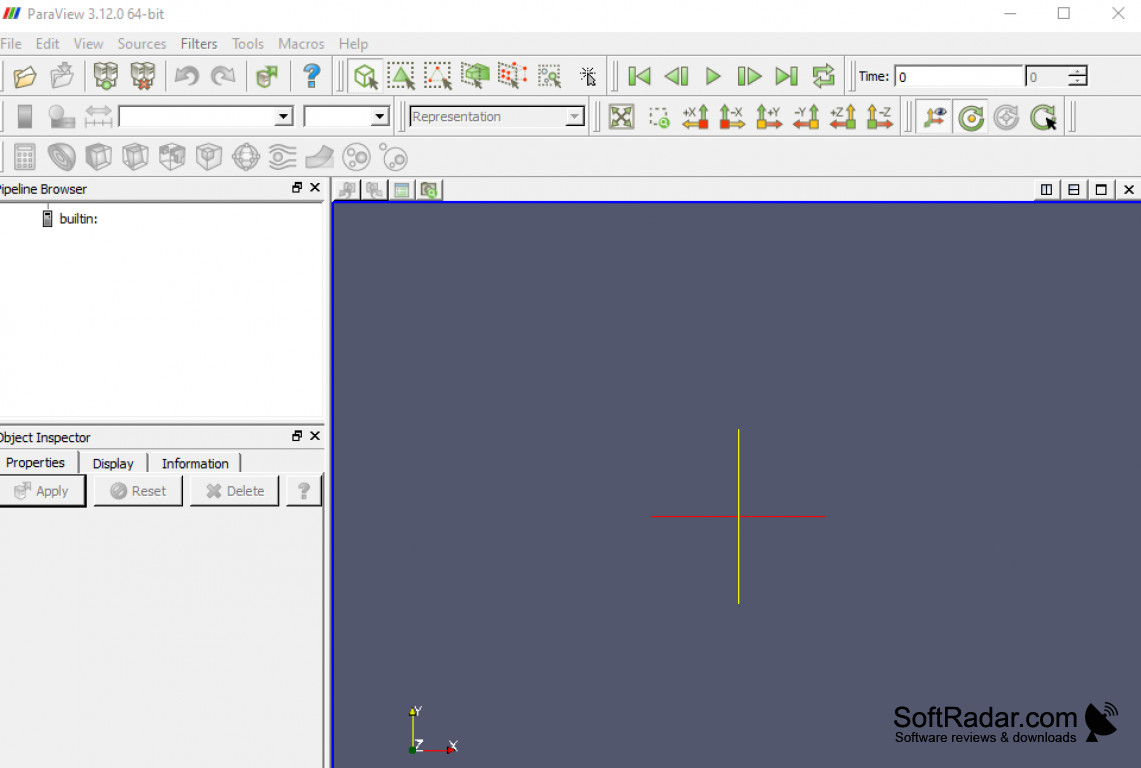
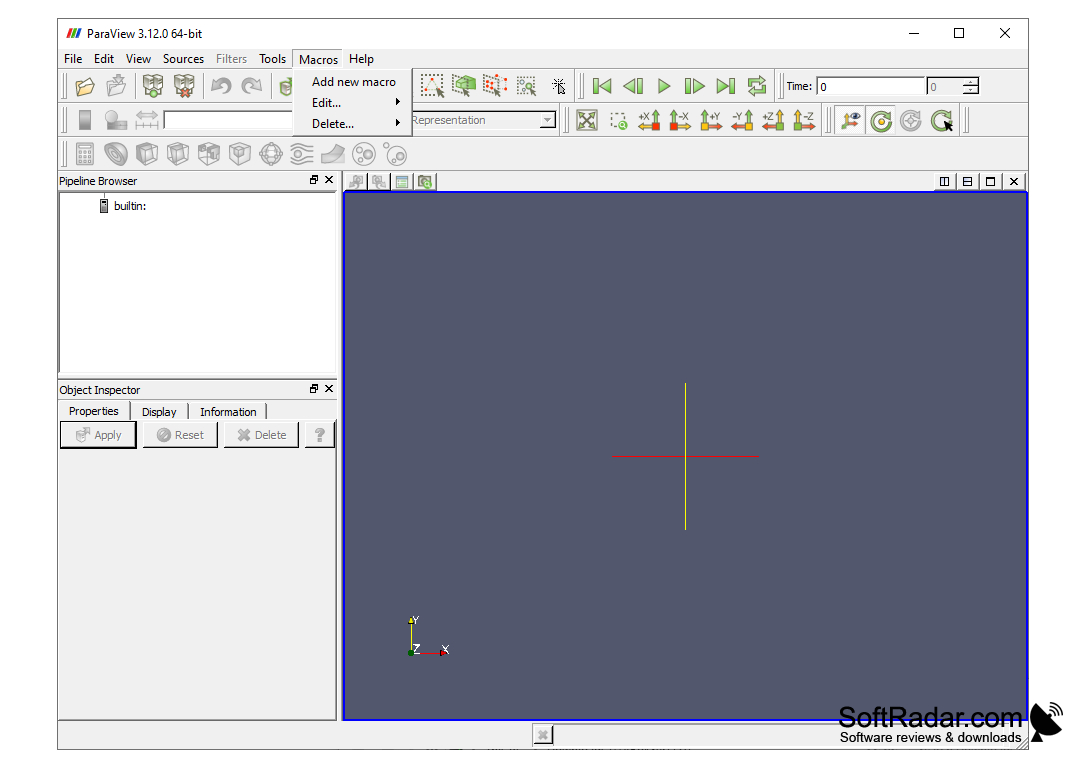
ParaView provides an intuitive graphical interface for powerful interactive 3D visualization and analysis of large datasets.Features:
• Data Formats: ParaView supports a wide range of data formats, including structured and unstructured grids, polygonal meshes, image data, and point-based data.
• Visualization: ParaView offers a range of visualization tools, including 3D rendering, interactive plotting, volume rendering, and animation.
• Analysis: ParaView offers a range of analysis tools that allow users to measure, analyze, and interpret data.
• Filtering: ParaView offers a variety of filters, including traditional filters such as Gaussian blur and edge detection, as well as advanced filters for data manipulation and feature detection.
• Animation: ParaView offers a powerful animation system, allowing users to create and modify animations quickly and easily.
• User Interface: ParaView has a flexible user interface, allowing users to customize their experience to fit their needs.
• Collaboration: ParaView offers collaborative tools, allowing users to share and collaborate on data analysis and visualization projects.
• Scripting: ParaView offers a scripting API, allowing users to extend the functionality of the application and automate tasks.
• Extensions: ParaView offers a range of extension modules, allowing users to access additional features and tools.
• Visualization Pipelines: ParaView offers a powerful visualization pipeline API, allowing users to create complex visualizations.
• Rendering: ParaView offers a range of advanced rendering techniques, such as ambient occlusion and global illumination.
• Parallel Processing: ParaView offers support for parallel processing, allowing users to take advantage of multi-core processors and distributed computing resources.
ParaView is a free, open-source 3D scientific visualization application and data analysis tool for Windows, Linux, and macOS. The software is capable of running on a variety of hardware configurations, including desktop systems and high-performance computing clusters. To run ParaView, the following system requirements should be met:
• Operating System: Windows, Linux (Ubuntu 16.04 and above, Fedora 21 and above) macOS 10.12 and above
• Processor: Intel/AMD x86-64 compatible processor
• Memory: 4 GB RAM minimum
• Graphic Card: OpenGL 3.3 compatible graphics card (NVIDIA, AMD, Intel)
• Hard Disk: 500 MB of available space
• Network: A network connection is required for remote data access and data sharing
• Software: Python 2.7+ and a web browser are required for some advanced features
PROS
Easy to use with intuitive graphical user interface.
Supports a wide range of data formats.
Has advanced visualization and data analysis functions.
Supports a wide range of data formats.
Has advanced visualization and data analysis functions.
CONS
High learning curve for non-technical users.
Limited compatibility with certain data formats.
Occasional performance issues with larger datasets.
Limited compatibility with certain data formats.
Occasional performance issues with larger datasets.