Graph

by Ivan Johansen

Older versions and the source code for Graph is available from SourceForge

Operating system: Windows

Publisher: Ivan Johansen

Release : Graph 4.4.2

Antivirus check: passed

Report a Problem

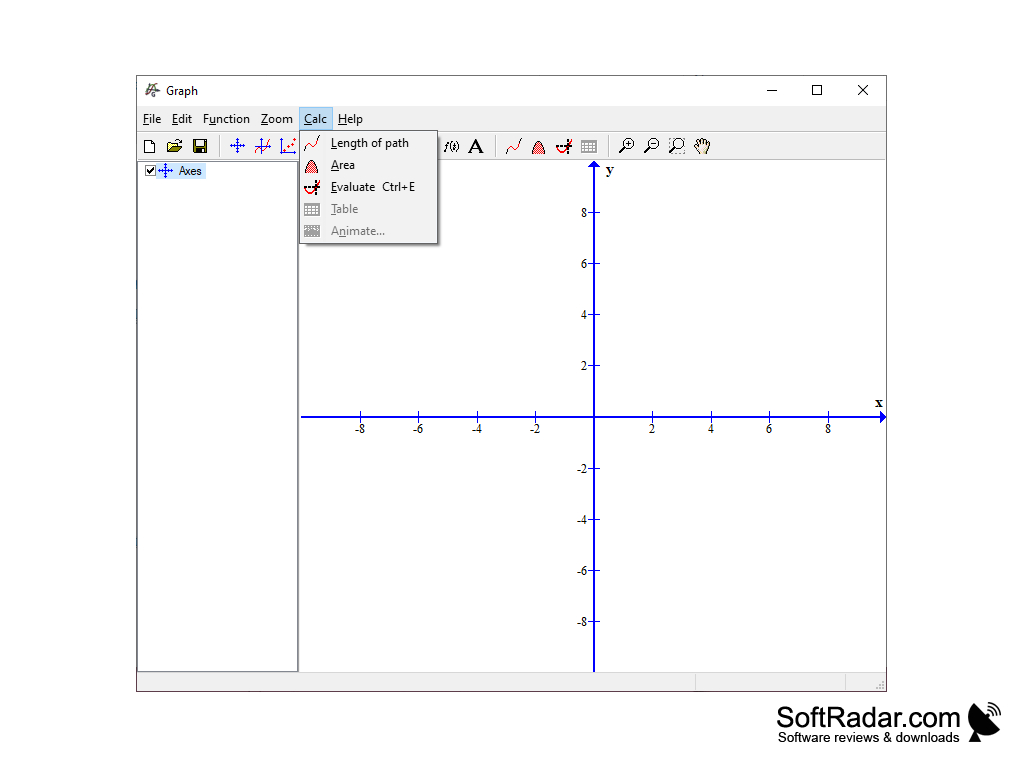
Graph is an open source program designed to build mathematical charts. This application supports all standard functions and allows you to build charts of sinuses, cosines, logarithms, etc. You can specify the color, thickness and style of the lines on the chart, as well as limit the range of input data. Graph also allows you to show conditions of equality and inequality of parts of the equation, visually highlight parts of the chart, build trend lines and import data from external applications (e.g., Excel). You can save ready-made graphics in several formats - PDF, SVG, EMF, JPG, PNG and BMP. In addition, Graph allows you to export the coordinate system (as an image or as an OLE object) to other applications (e.g., Word). The program is able to display tables with calculated function values, allows you to add text comments to the charts, create your own functions and constants, animate charts and much more.

Graph software simplifies the process of creating detailed, customizable mathematical charts, ideal for data analysis and visual presentations.

- Drawing charts of mathematical functions;

- adjustment of chart parameters - line thickness and color, inscriptions, etc;

- Export ready-made graphics to several formats (PDF, JPG, SVG, etc.);

- the possibility of animating graphics.


PROS
Easily visualizes complex data in a digestible format.
Offers diverse graph and chart options.
Enhances understanding and interpretation of data.

CONS
May require advanced knowledge to navigate and use effectively.
Limited customer support can make troubleshooting difficult.
Complex interface could deter beginner users.
Graph 4.4.2 (9.61 MB)
image/svg+xmlBotttsPablo Stanleyhttps://bottts.com/Florian Körner Luca
This program helps build mathematical charts. It supports all standard functions that can be customized. It is very versatile and will allow you to extort information to other applications. It seems like it would do amazing things for someone who was needing to convert files and it has a five star rating.
image/svg+xmlBotttsPablo Stanleyhttps://bottts.com/Florian Körner John
The product description is clear and concise. Although highly specific to the field and requiring knowledge to understand the terminology, it is well described and gives a full explanation of the main features of the product. The brief bullet points following the main description also summarise the product well.
image/svg+xmlBotttsPablo Stanleyhttps://bottts.com/Florian Körner Callum
I am currently working on my thesis for my math degree. Graph was very useful for me as I needed to create graphs for my thesis. It was very easy to use it to visualize my data and helped me with some of the math calculations that I needed to do. I wrote my thesis using Word and was easy to paste the graph into the document.
image/svg+xmlBotttsPablo Stanleyhttps://bottts.com/Florian Körner Aaron Mosa
Graph software is a type of computer software used to create and analyze graphs, which are visual representations of relationships between data points. Graph software typically includes tools for creating graphs, displaying data, and manipulating data points. It can also be used to analyze relationships between data points and to identify patterns in data.
image/svg+xmlBotttsPablo Stanleyhttps://bottts.com/Florian Körner Leo S********y
Graph software is an extremely useful tool when it comes to understanding data. It is easy to create interactive visualizations that help to understand complex information. I find it helpful for quickly exploring data and discovering insights. The variety of chart types and customizable options make it a great choice for data analysis. It is also quite intuitive and user-friendly, so getting started is straightforward. Plus, the design of the charts is visually attractive and well-suited for sharing. I really appreciate how quickly I am able to create professional looking charts.
image/svg+xmlBotttsPablo Stanleyhttps://bottts.com/Florian Körner Noah L.
Graph software is user-friendly and intuitive to use. It makes it easy to create and visualize various kinds of graphs. I particularly appreciate the ability to customize the graph elements. The software also allows to easily export the graphs to other applications. Layout and design options are also great.
image/svg+xmlBotttsPablo Stanleyhttps://bottts.com/Florian Körner Lewis Kirschbaum
Graph software is great for visualizing data, however there's a learning curve to get used to the complex interfacce.
image/svg+xmlBotttsPablo Stanleyhttps://bottts.com/Florian Körner Kai U*******q
The ability to quickly and accurately visualize data is a great asset.
image/svg+xmlBotttsPablo Stanleyhttps://bottts.com/Florian Körner Callum Schiebout
The graph software provides a wide range of options for creating and customizing graphs. It is user-friendly and intuitive, with a variety of templates and themes available. The ability to import data from various sources is a helpful feature, but the lack of advanced customization options may be a limitation for some users. Overall, it is a useful tool for presenting data in a visually appealing way.
image/svg+xmlBotttsPablo Stanleyhttps://bottts.com/Florian Körner Cameron M.
Graph software is a useful tool for creating and analyzing visual representations of data.
image/svg+xmlBotttsPablo Stanleyhttps://bottts.com/Florian Körner Mason
Intuitive interface, robust toolset, great for data visualization. Powerful, complex, requires a learning curve. Excellent graphics, easy to manipulate data. Ideal for advanced statistical analysis. Highly customizable graphs, impressive dynamic capabilities. Frustratingly complex, clunky user interface. Provides a wide range of visualization options. Excellent tool for plotting mathematical functions. Great for academic research, steep learning curve. Simple to use, good for basic graphs.
Ethan
Graph software helps visualize data in colorful pictures.
MapSource
Create, view, and edit information on windows
Scratch
Free programming language and online community where you can create your own interactive stories
Global Mapper
Mapper necessary for Windows system
QTranslate
Allows for translating for windows services
ActivInspire
Collaborative delivery software for multiple components