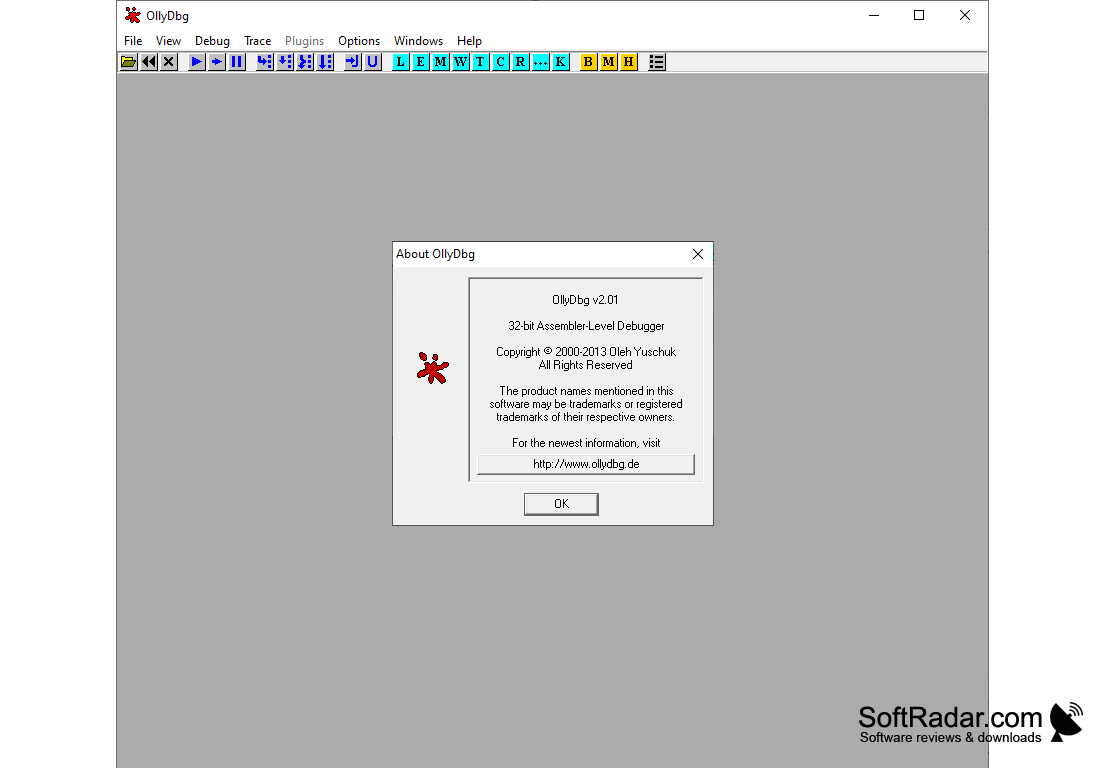
Olly Debugger

by Oleh Yuschuk

A debugger that emphasizes binary code analysis

Operating system: Windows

Publisher: Oleh Yuschuk

Antivirus check: passed

Report a Problem

OllyDbg 2.0 is a User Space level debugger that has become very popular among users all over the world. Now there are a lot of plugins written for OllyDbg, so it is a pleasure to work with it. OllyDbg has good functionality that makes it suitable for solving various tasks and researching code of any complexity. The debugger interface is fully customizable: work window background, font color and size, illumination of certain assembly instructions and much more.

OllyDbg provides extensive functionality and customization options making it suitable for analyzing and researching code of any complexity.
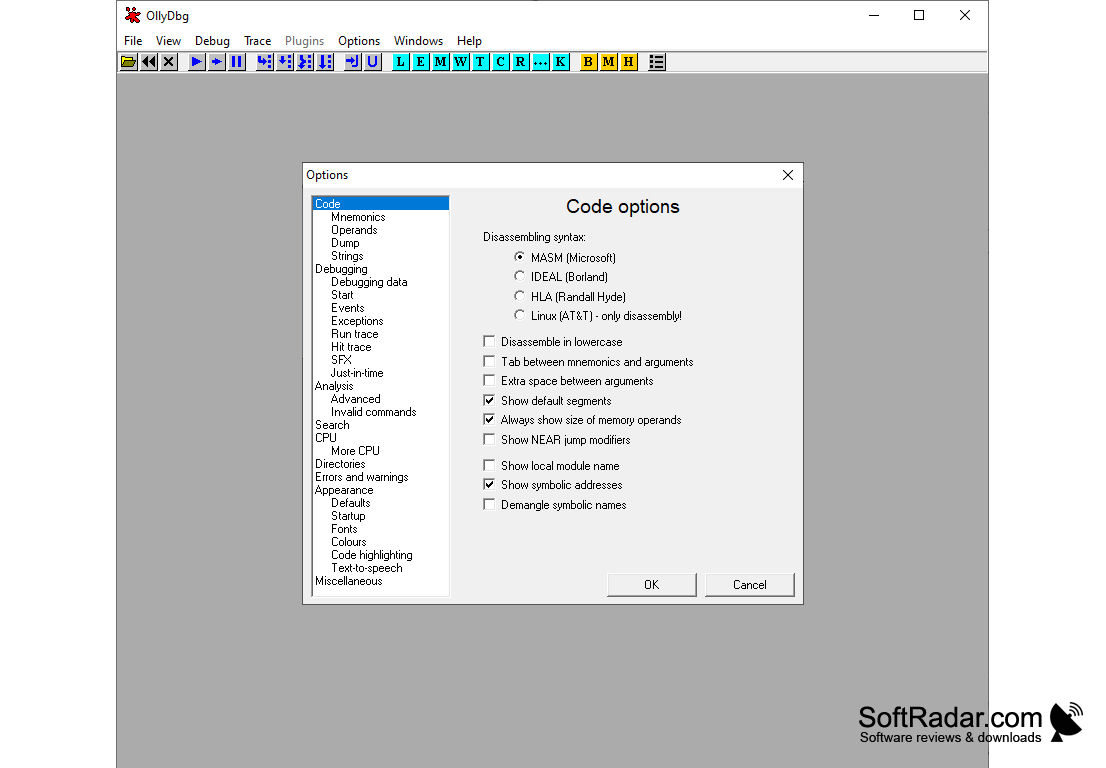
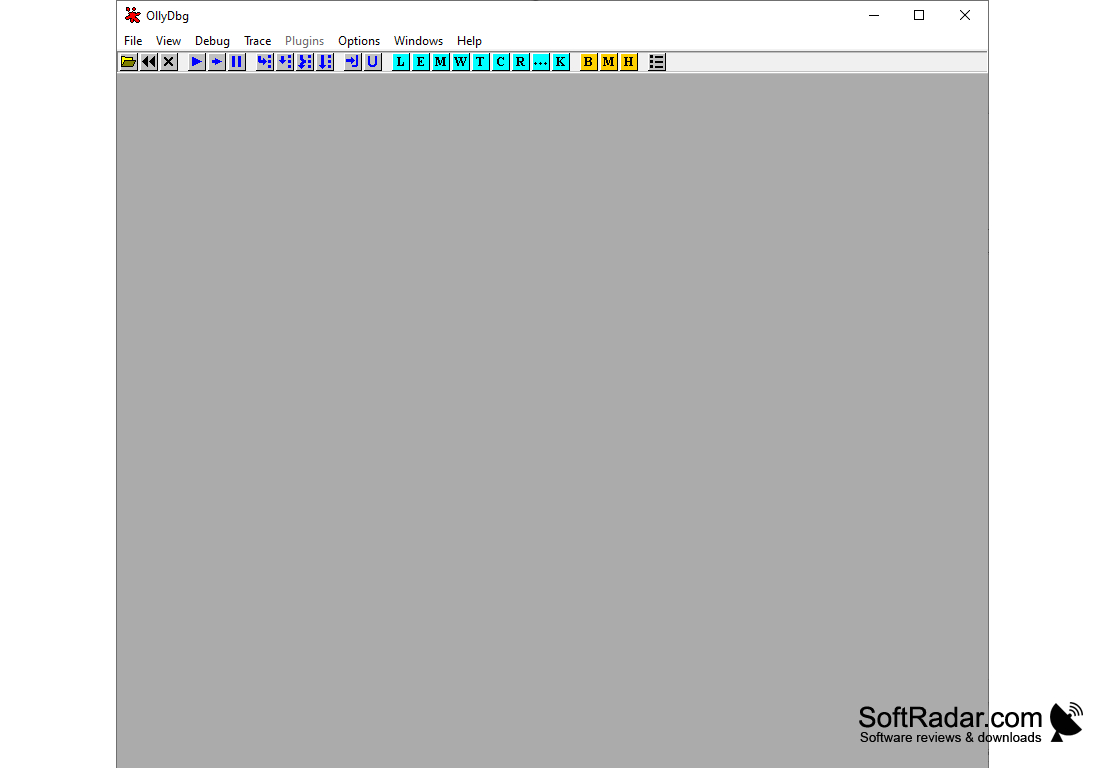
Interface:

- The interface consists of program code windows, registers, stack, and memory dump. The background and font colors can be set to your liking. At the top of the quick access buttons to the main functions, and the most frequent operations.
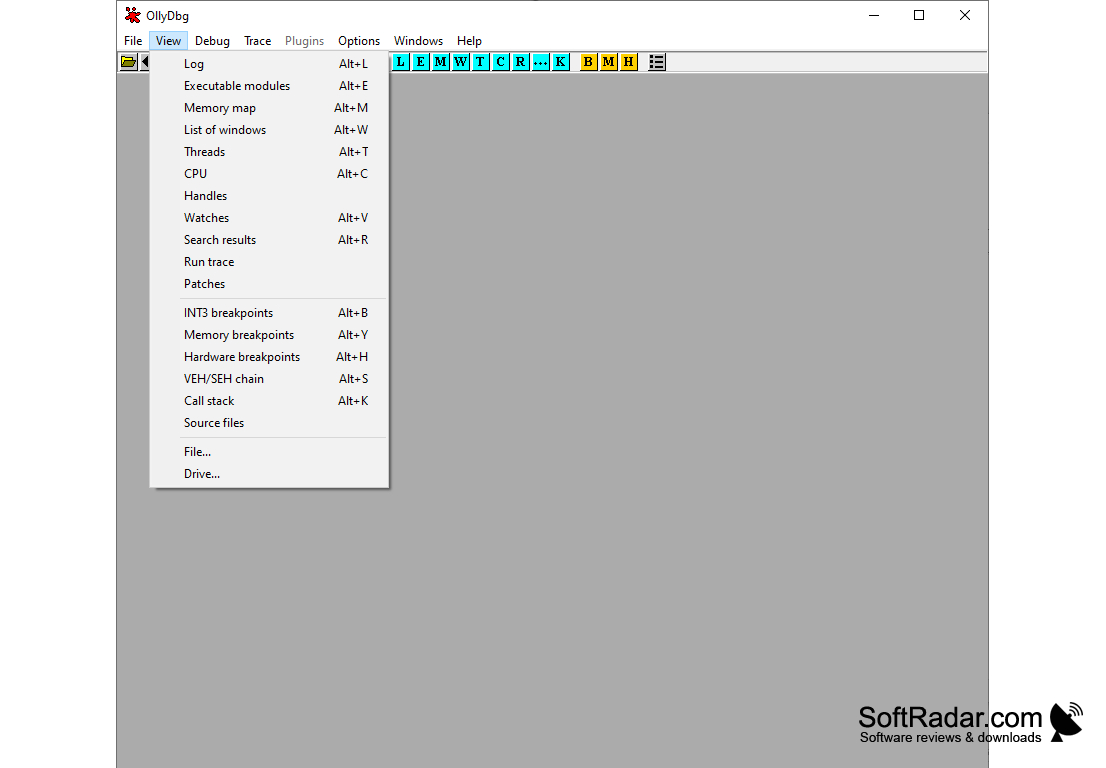
Functions:

- the list of functions used in the debugged program;

- the list of string variables found in the program;

- the list of handles of the program being debugged, such as: window, buttons, checkboxes, toolbars and others;

Breakpoints. It is possible to set several breakpoints (including simultaneous ones):

- on a particular function;

- to a specific address;

- to the Windows message;

- to read from memory;

- for a memory entry;

- to access memory (read and write);

- to a certain sequence of code instructions;

It is possible to specify specific conditions for breakpoints, for example, a certain value of the specified register and much more. The log file writing function is supported:

- values in the stack are accompanied by comments, which helps to understand function arguments more easily.

Tracing:

- when the code is executed step by step, before each instruction the debugger prompts the current value of memory addresses, which are being operated on.

Search for values in memory:

- supports searching for ASCII and Unicode strings, as well as hex values.

The code window:

- the program code is accompanied by comments such as function names, their arguments, variable values and others.


PROS
Highly customizable and user-friendly interface.
Offers rich-featured debugging capabilities.
Supports both 32-bit and 64-bit applications.

CONS
No longer updated, thus lacks modern features and improvements.
Steep learning curve, especially for beginners.
Not suitable for debugging complex software.
image/svg+xmlBotttsPablo Stanleyhttps://bottts.com/Florian Körner Alfie
The Olly Debuggger is awesome. It does all the standard things you want in a debugger, but it adds some nice bonuses. It doesn't matter how complex the code is, you can still use it. I also love that you can customize it - I love things like that - especially that you can change the font. I always like being able to choose my own font, so that's a great feature.
image/svg+xmlBotttsPablo Stanleyhttps://bottts.com/Florian Körner Jay
The link did not work correctly for me
image/svg+xmlBotttsPablo Stanleyhttps://bottts.com/Florian Körner Oscar
Olly Debugger is a free debugging program for Windows. The debugging program was created by Oleh Yuschuk, and it offers many different features. Olly Debugger enables users to input different commands, use breakpoints, code trace, and many other features to maximize efficiency. At a free price point, this program is unbeatable.
image/svg+xmlBotttsPablo Stanleyhttps://bottts.com/Florian Körner Aidan
Great product traces recognizes api codes and locating routine objects is always something that is defiantly needed. Emphasizing binary code analysis is a given. Been around since 2019 . Reasonably priced
image/svg+xmlBotttsPablo Stanleyhttps://bottts.com/Florian Körner Kayden
Olly Debugger for Windows has many impressive features, let's touch on a few: (1) It can debug multithread applications and show fixups. (2) It can decode calls to well over 1900 standard API and 400 C functions. (3) It can recognize the most complex code constructs. (4) It is intuitive, can attach to running programs, trace registers, recognize procedures, loops, API Calls, switches, tables, constants and strings, and much more!
image/svg+xmlBotttsPablo Stanleyhttps://bottts.com/Florian Körner Freddie W********c
Olly Debugger is a Windows-based program designed for reverse engineering and debugging 32-bit and 64-bit applications. It supports both user and kernel-mode debugging, and is able to analyze instructions in assembly language to help developers troubleshoot and debug their applications. Olly Debugger also includes a wide range of features, such as breakpoints, memory patching, and plugin support.
image/svg+xmlBotttsPablo Stanleyhttps://bottts.com/Florian Körner James T.
1. Olly Debugger is a powerful software for debugging applications. 2. It's very easy to use and understand, with a great user interface. 3. It provides useful information about the program's memory and registers. 4. It has a lot of useful features such as breakpoints, watchpoints and breakpoints on data access. 5. The symbol information for the functions helps to understand the code better. 6. It also supports the debugging of 64 bit applications. 7. It can be used to search for strings and binary patterns in the application's memory. 8. It can be used to disassemble code as well as examine and modify the memory. 9. I found it to be a great tool for debugging applications. 10. Olly Debugger is an invaluable tool for any programmer.
image/svg+xmlBotttsPablo Stanleyhttps://bottts.com/Florian Körner Calvin Arkle
Olly Debugger is a pretty good debbuging tool. I've used it several times and it's proved to be quite reliable. It has some nice features such as breakpoints and monitering of CPU registers. It can be a bit diffcult to figure out the interface at first, but once you get the hang of it it's quite intuative. The only downside I found is that it can be slow to responding sometimes.
image/svg+xmlBotttsPablo Stanleyhttps://bottts.com/Florian Körner Tyler Minh
It is a powerful debugging tool that allows users to analyze and modify executable files.
image/svg+xmlBotttsPablo Stanleyhttps://bottts.com/Florian Körner Jackson Z*********c
Olly Debugger is a software tool used to debug programs in Windows operating systems. It provides a wide range of features such as code analysis, memory manipulation, and breakpoint setting. It allows users to step through code, observe registers and memory, and modify values on the fly. The software also has a powerful search function to find specific values or instructions within a program. Olly Debugger is widely used by reverse engineers and malware analysts due to its flexibility and ease of use.
image/svg+xmlBotttsPablo Stanleyhttps://bottts.com/Florian Körner Murray Throesch
Olly Debugger is a powerful and flexible debugger software that is widely used for reverse engineering and debugging purposes.
image/svg+xmlBotttsPablo Stanleyhttps://bottts.com/Florian Körner Theo
Easy to use, but sometimes struggles with larger executables.
image/svg+xmlBotttsPablo Stanleyhttps://bottts.com/Florian Körner Liam
Easy to use, robust debugging tool.
image/svg+xmlBotttsPablo Stanleyhttps://bottts.com/Florian Körner Jake
Efficient, user-friendly, detailed analysis tool.
Syser Kernel Debugger
A popular kernel-level debugger with a full graphical interface
PE Explorer
This allows for hacking software information
FireBug
Firebug facilitated the debugging, editing and monitoring of any website's HTML,CSS and JavaScript
ILSpy

ILSpy is an open-source .NET assembly browser and decompiler

Apk Easy Tool
Apk Easy Tool is a graphical user interface that makes it easy to decompile, edit, and recompile Android APKs.