SciDAVis
by SciDAVis team
SciDAVis is a free cross-platform data analysis and visualization program.
Operating system: Windows
Publisher: SciDAVis team
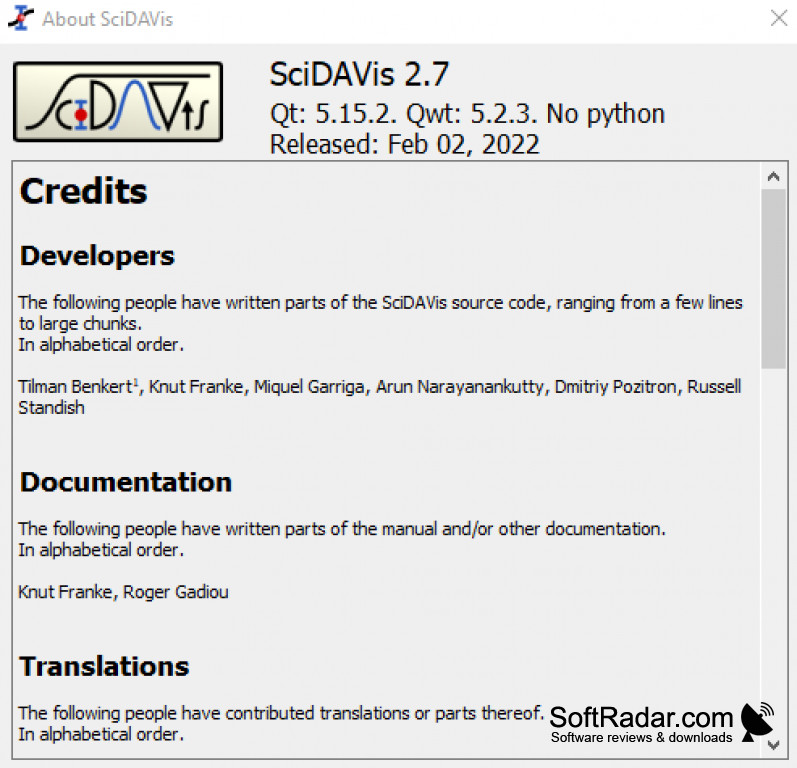
Release : SciDAVis 2.7
Antivirus check: passed

SciDAVis is a powerful and user friendly data analysis and visualization software developed by the Konstanz Information Miner (KIM) group. SciDAVis is designed to provide an intuitive and interactive environment for data analysis and visualization. It has a wide range of features that make it an ideal tool for scientists and researchers.
The main features of SciDAVis are:
Data Import: SciDAVis is capable of importing data from a variety of sources such as spreadsheets, databases, and text files. It can also read data from other programs such as Gnuplot, Origin, and Matlab.
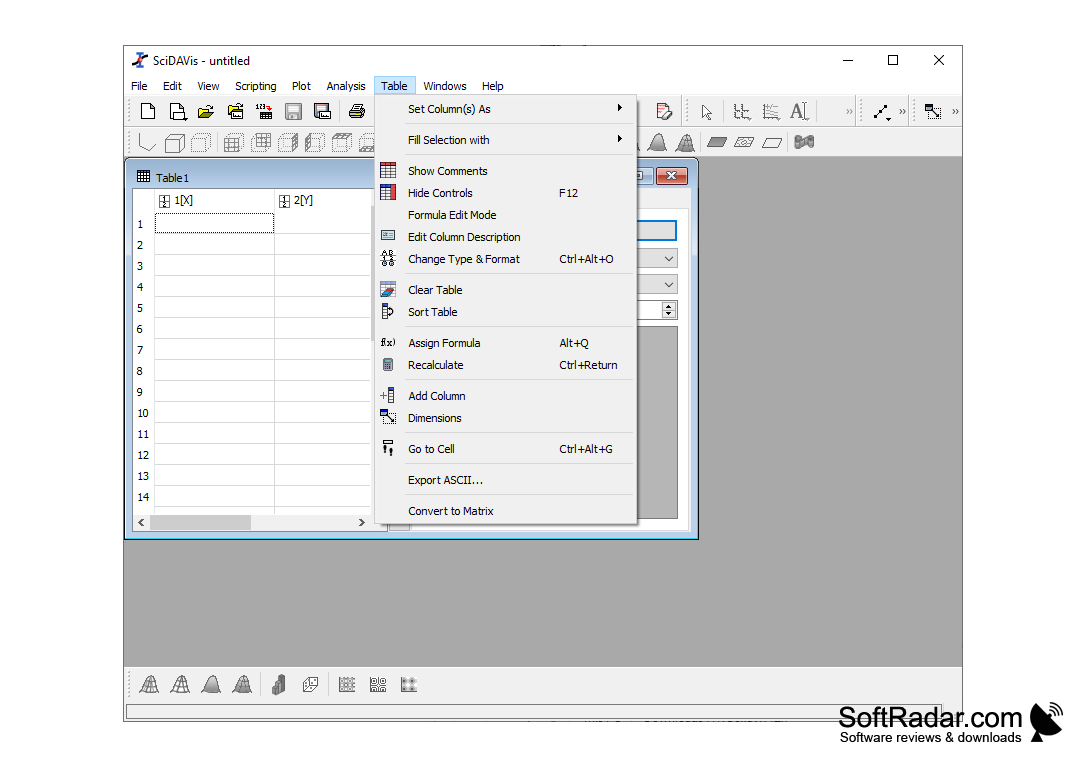
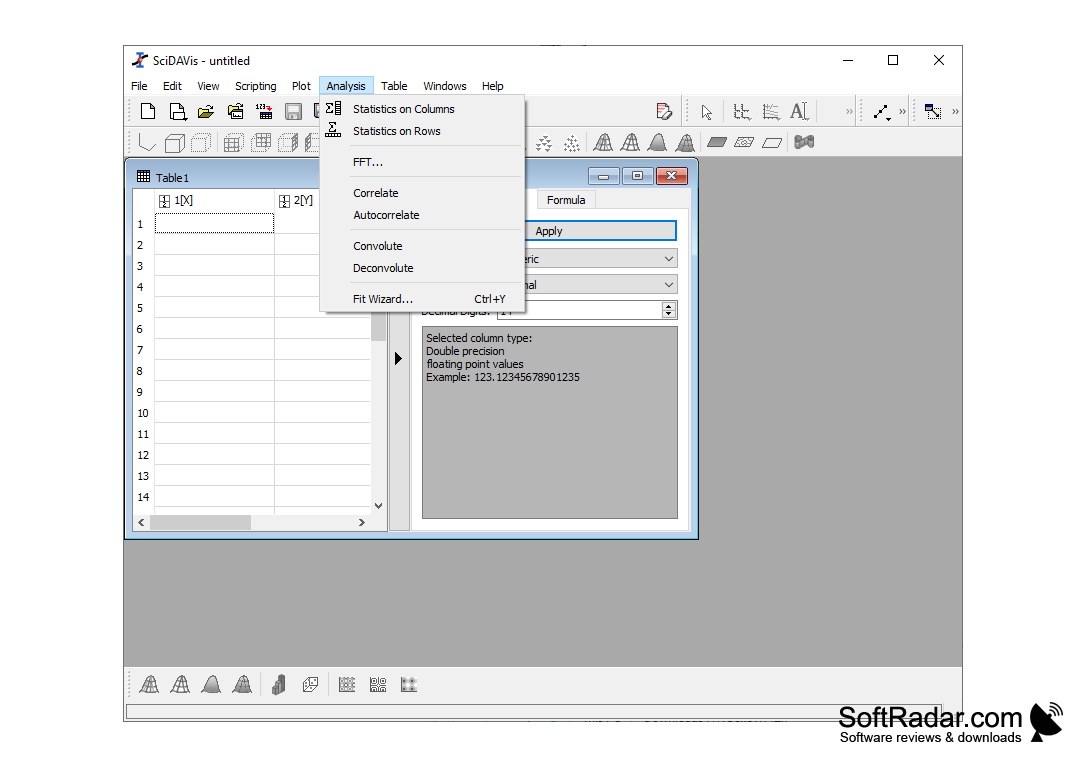
Data Analysis: SciDAVis offers a wide range of data analysis tools such as regression analysis, statistical tests, and curve fitting. It also provides a variety of graphical tools such as histograms, scatter plots, and box plots.
Data Visualization: SciDAVis allows users to easily create interactive and customizable graphs and charts. It includes a wide range of plotting options such as 3-D plots, surface plots, and contour plots.
Data Export: SciDAVis is capable of exporting data in a variety of formats such as text, images, and vector graphics.
Programming Interface: SciDAVis provides a powerful scripting interface which allows users to automate tasks and create custom analysis tools.
Documentation: SciDAVis includes a comprehensive manual and online tutorials to help users get started quickly and easily.
These features make SciDAVis a powerful and versatile data analysis and visualization tool. It is easy to use and provides a wide range of features that make it suitable for a variety of data analysis tasks.
The main features of SciDAVis are:
Data Import: SciDAVis is capable of importing data from a variety of sources such as spreadsheets, databases, and text files. It can also read data from other programs such as Gnuplot, Origin, and Matlab.
Data Analysis: SciDAVis offers a wide range of data analysis tools such as regression analysis, statistical tests, and curve fitting. It also provides a variety of graphical tools such as histograms, scatter plots, and box plots.
Data Visualization: SciDAVis allows users to easily create interactive and customizable graphs and charts. It includes a wide range of plotting options such as 3-D plots, surface plots, and contour plots.
Data Export: SciDAVis is capable of exporting data in a variety of formats such as text, images, and vector graphics.
Programming Interface: SciDAVis provides a powerful scripting interface which allows users to automate tasks and create custom analysis tools.
Documentation: SciDAVis includes a comprehensive manual and online tutorials to help users get started quickly and easily.
These features make SciDAVis a powerful and versatile data analysis and visualization tool. It is easy to use and provides a wide range of features that make it suitable for a variety of data analysis tasks.
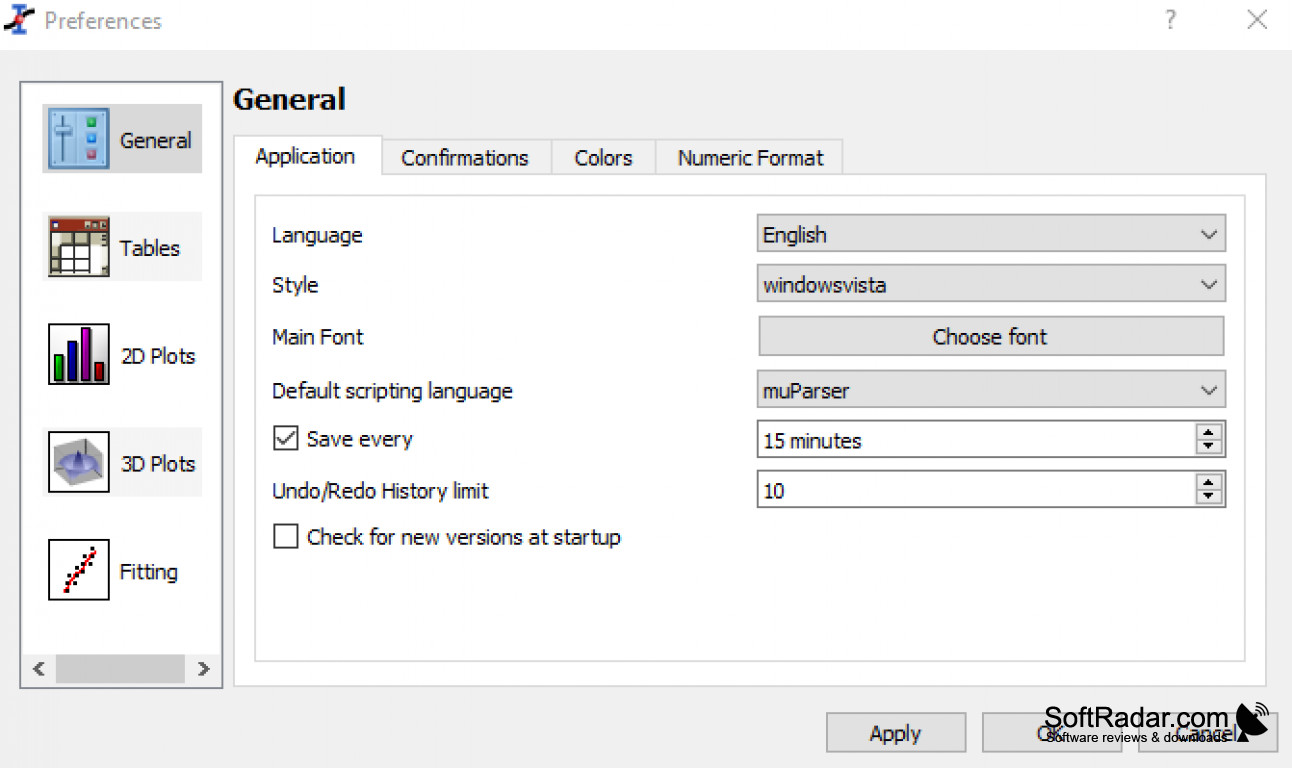
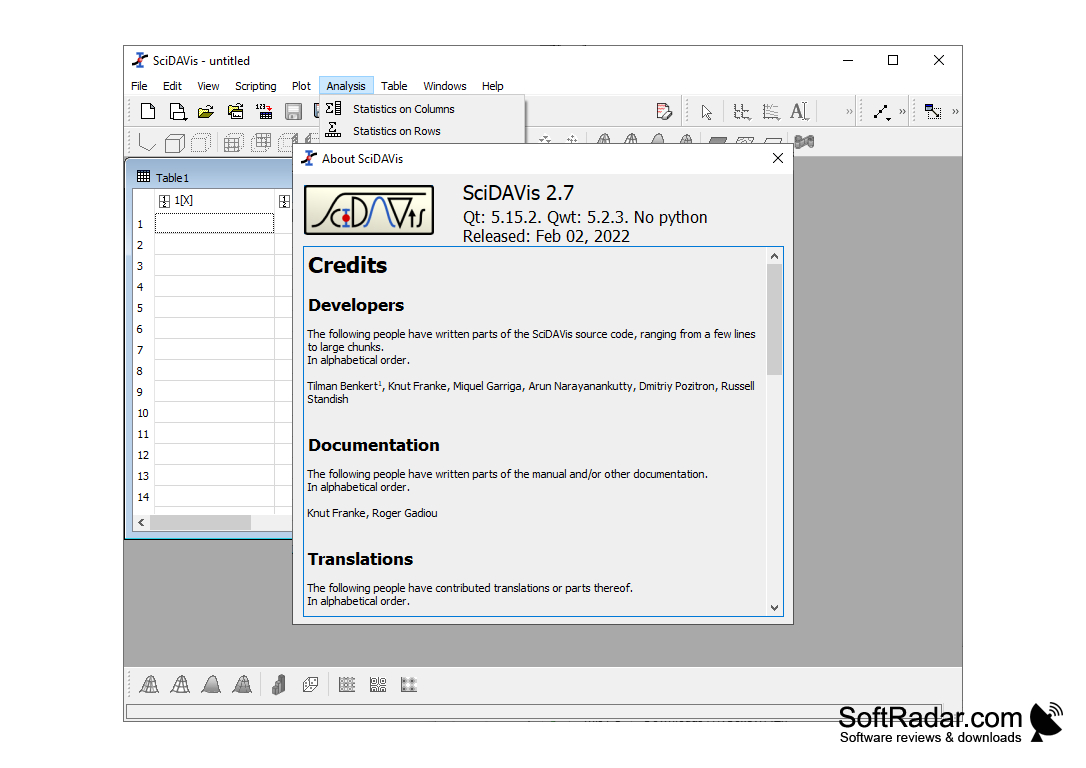
ScaDAVis provides an intuitive graphical user interface for data analysis, manipulation, and visualization.
SciDAVis is a cross-platform data analysis and visualization program. It runs on Windows, macOS, and Linux. The minimum system requirements are as follows:
Operating System: Windows XP, Vista, 7, 8, 10; macOS 10.7 or higher; Linux
Processor: Pentium 4 or higher
Memory: 1 GB RAM
Hard Disk Space: 50 MB free
Graphics: 1024×768 (or higher) resolution with 16-bit or higher color depth
Additional Software: QT library version 4.6 or higher
Operating System: Windows XP, Vista, 7, 8, 10; macOS 10.7 or higher; Linux
Processor: Pentium 4 or higher
Memory: 1 GB RAM
Hard Disk Space: 50 MB free
Graphics: 1024×768 (or higher) resolution with 16-bit or higher color depth
Additional Software: QT library version 4.6 or higher
PROS
Offers detailed 2D and 3D graphing capabilities.
Provides sophisticated data analysis and manipulation tools.
Easy to use with intuitive user interface.
Provides sophisticated data analysis and manipulation tools.
Easy to use with intuitive user interface.
CONS
Limited documentation for troubleshooting and learning advanced features.
Interface may seem outdated compared to modern data analysis tools.
Requires prior knowledge of statistical methods to effectively utilize software.
Interface may seem outdated compared to modern data analysis tools.
Requires prior knowledge of statistical methods to effectively utilize software.